5. Anomaly Detection
Now that you have sent data to MSK via. the two python scripts in Cloud9. Lets first validate that we can see the log data in OpenSearch. Then second, lets create our anomaly detector.
Step 1 - Create Index Pattern
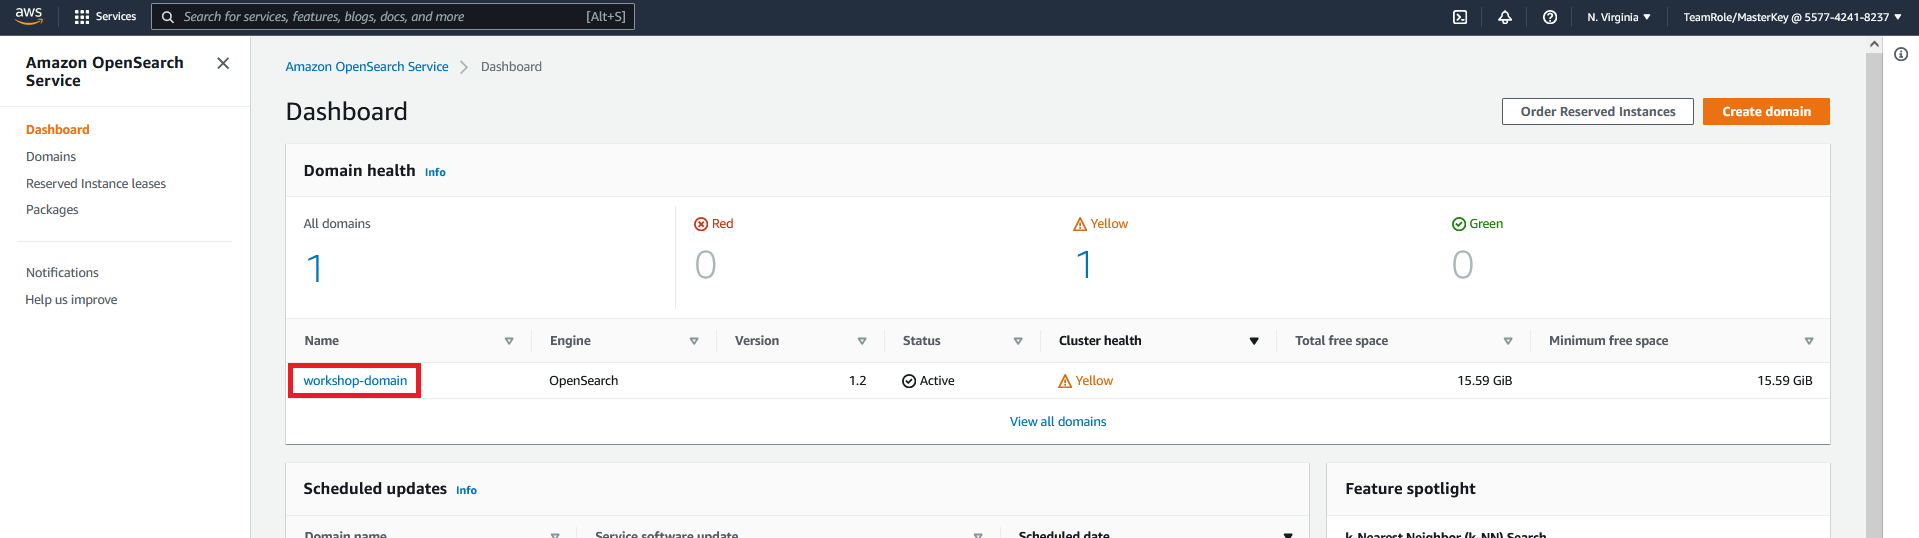
- Navigate to the OpenSearch page in the AWS console
- Click on workshop-domain
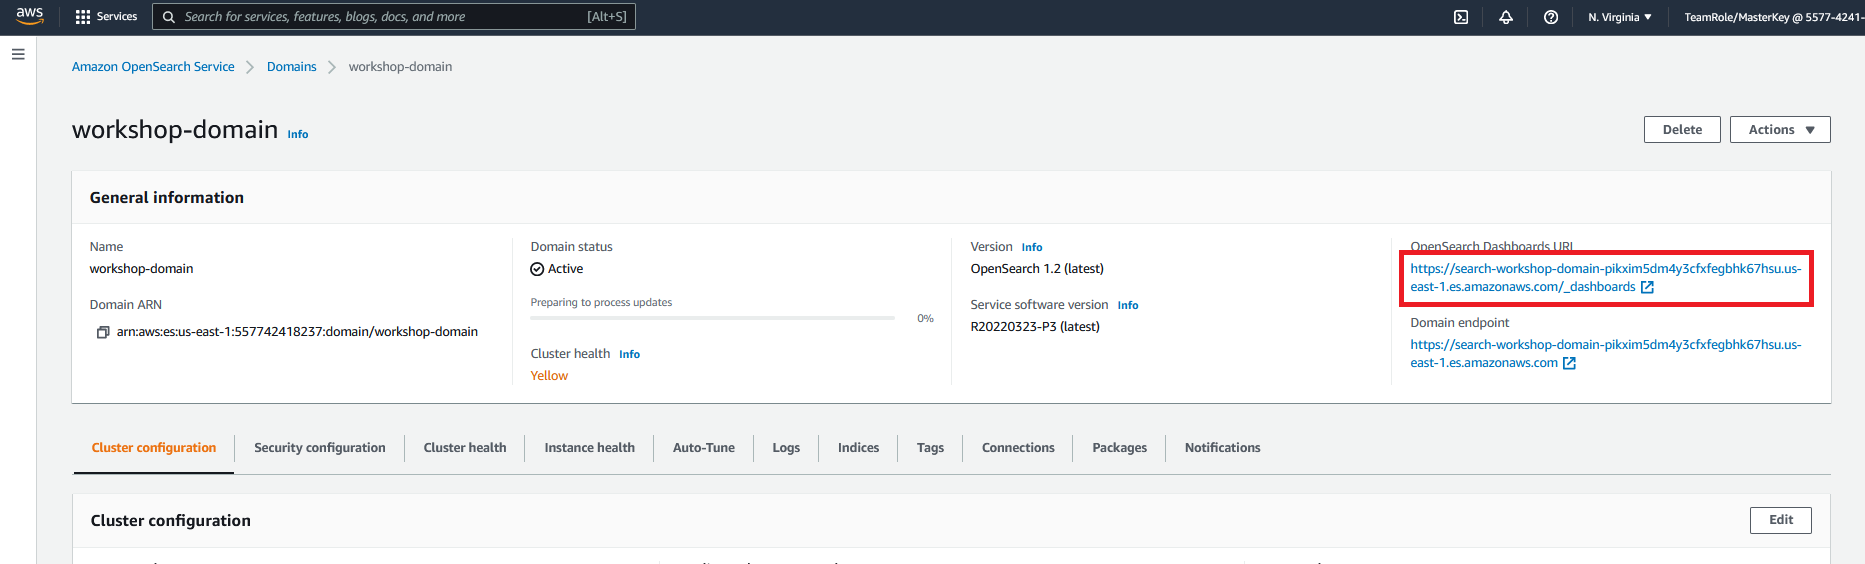
- Click on the OpenSearch Dashboards URL
- You will be prompted to log in. For the user name enter
OSMasterUserfor the password enterAwS#OpenSearch1 - If an additional popup window is present after login asking about data upload click on Explore on my own
- If an additional popup window is present asking you to select your tenant select Global and click on Confirm
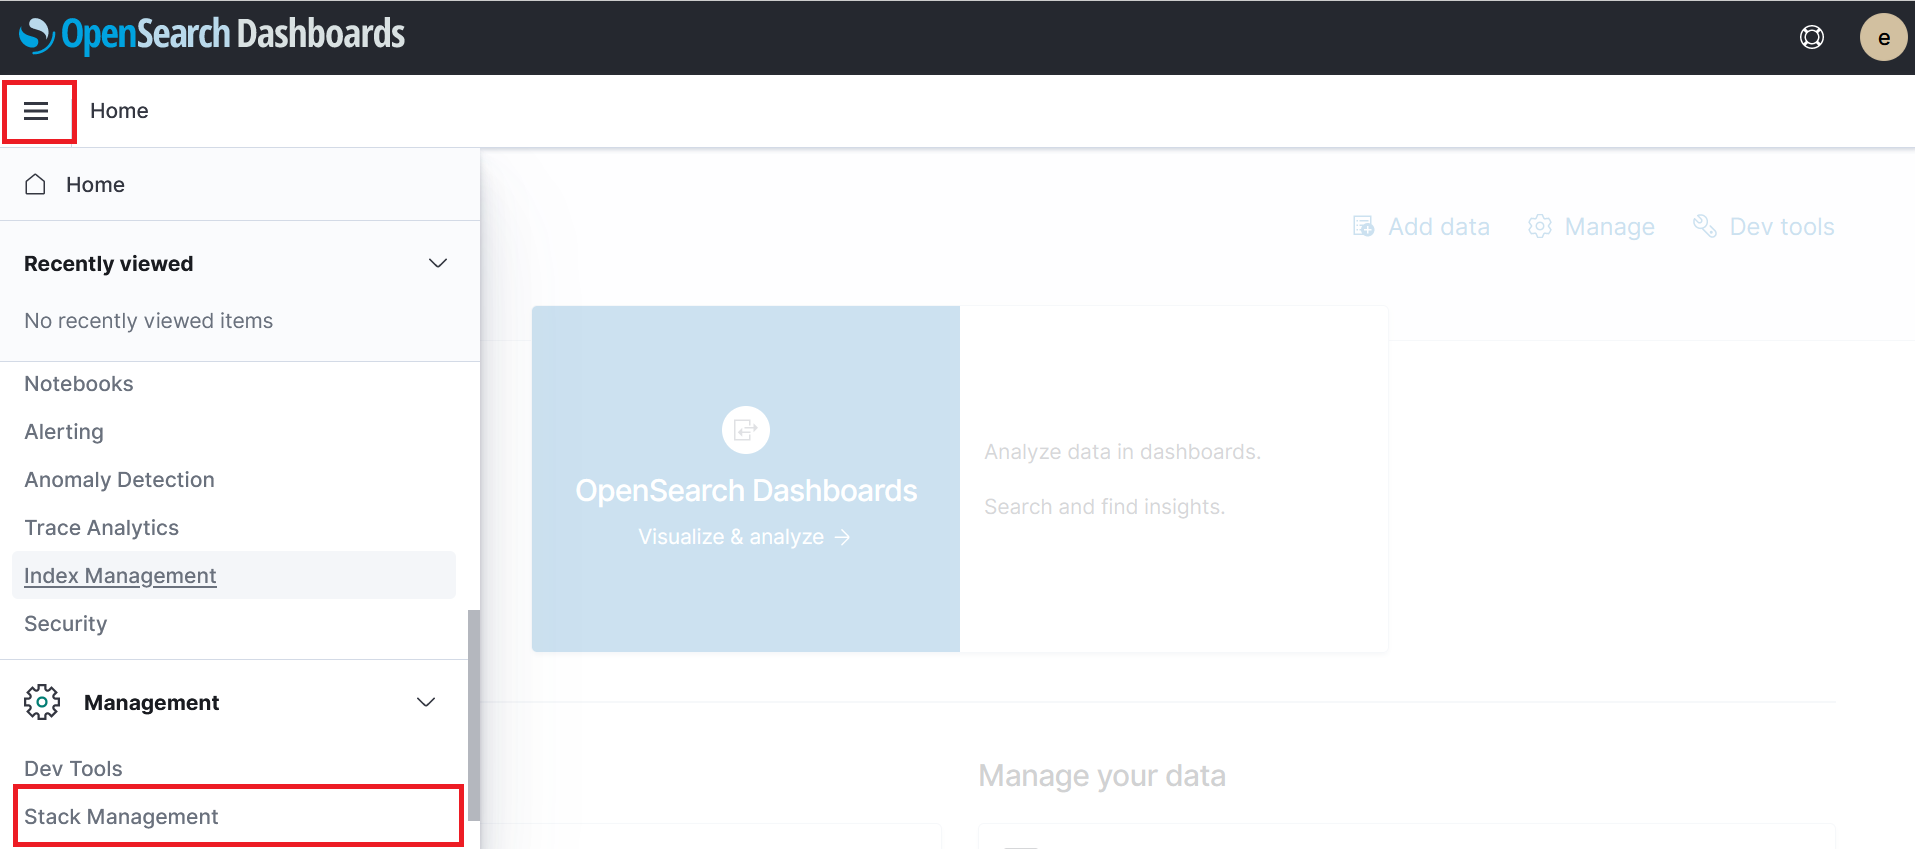
- In the OpenSearch Dashboard, expand the side menu and click on Stack Management under management section
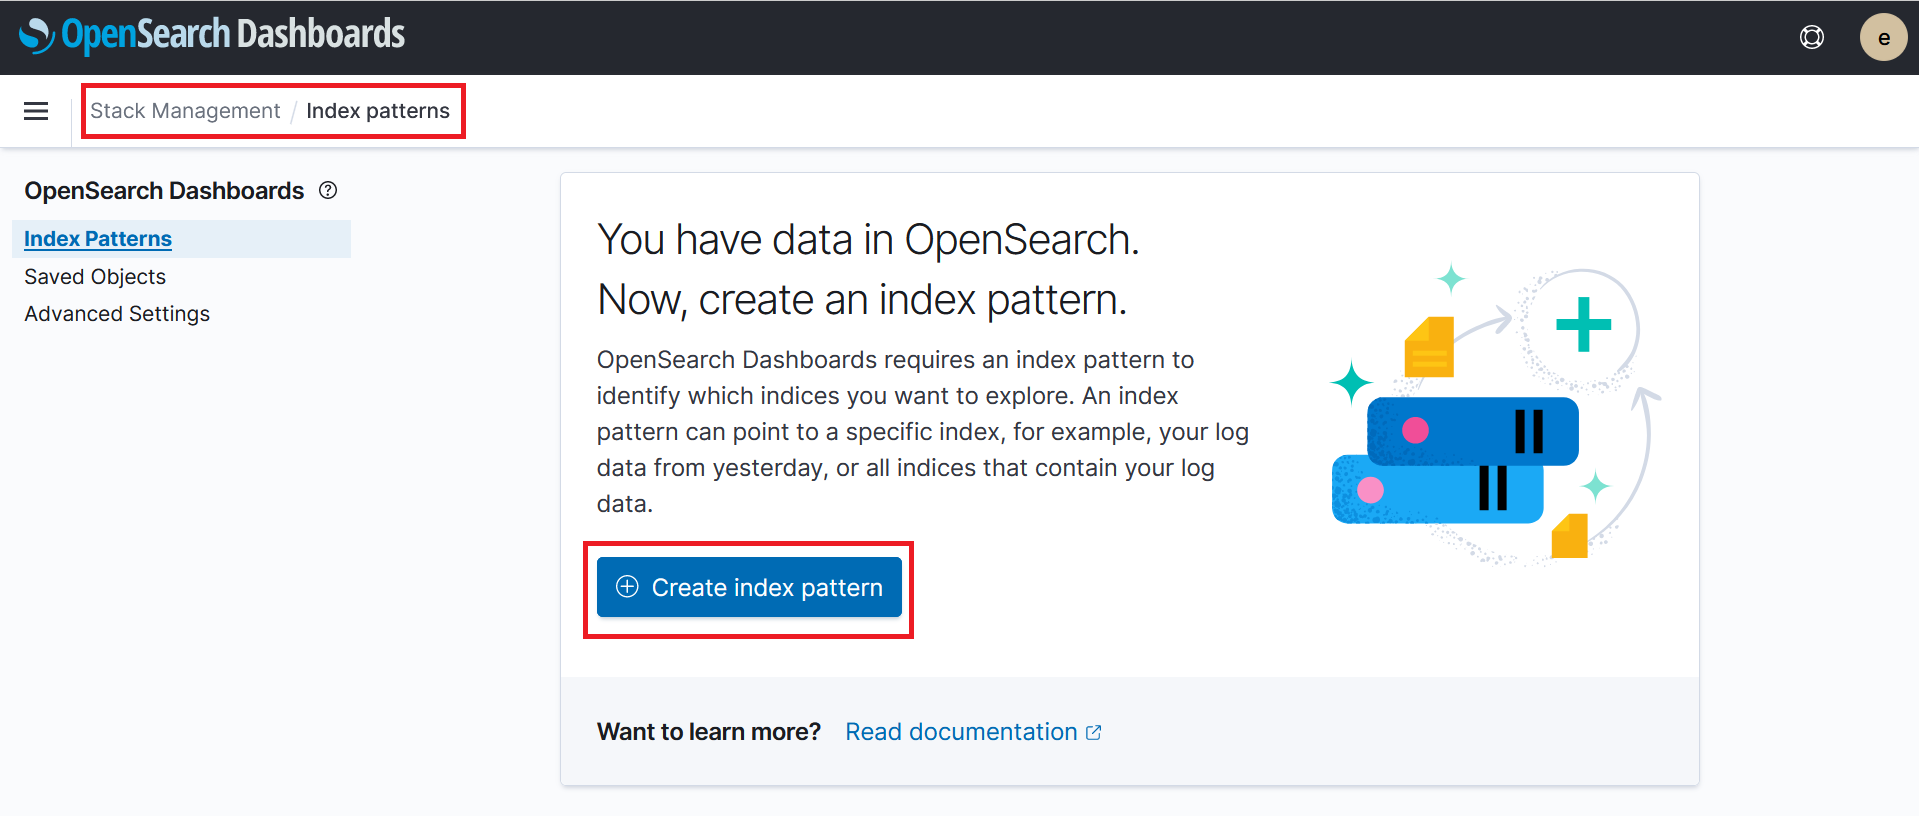
- On the stack management page click on Index Patterns on the left hand menu
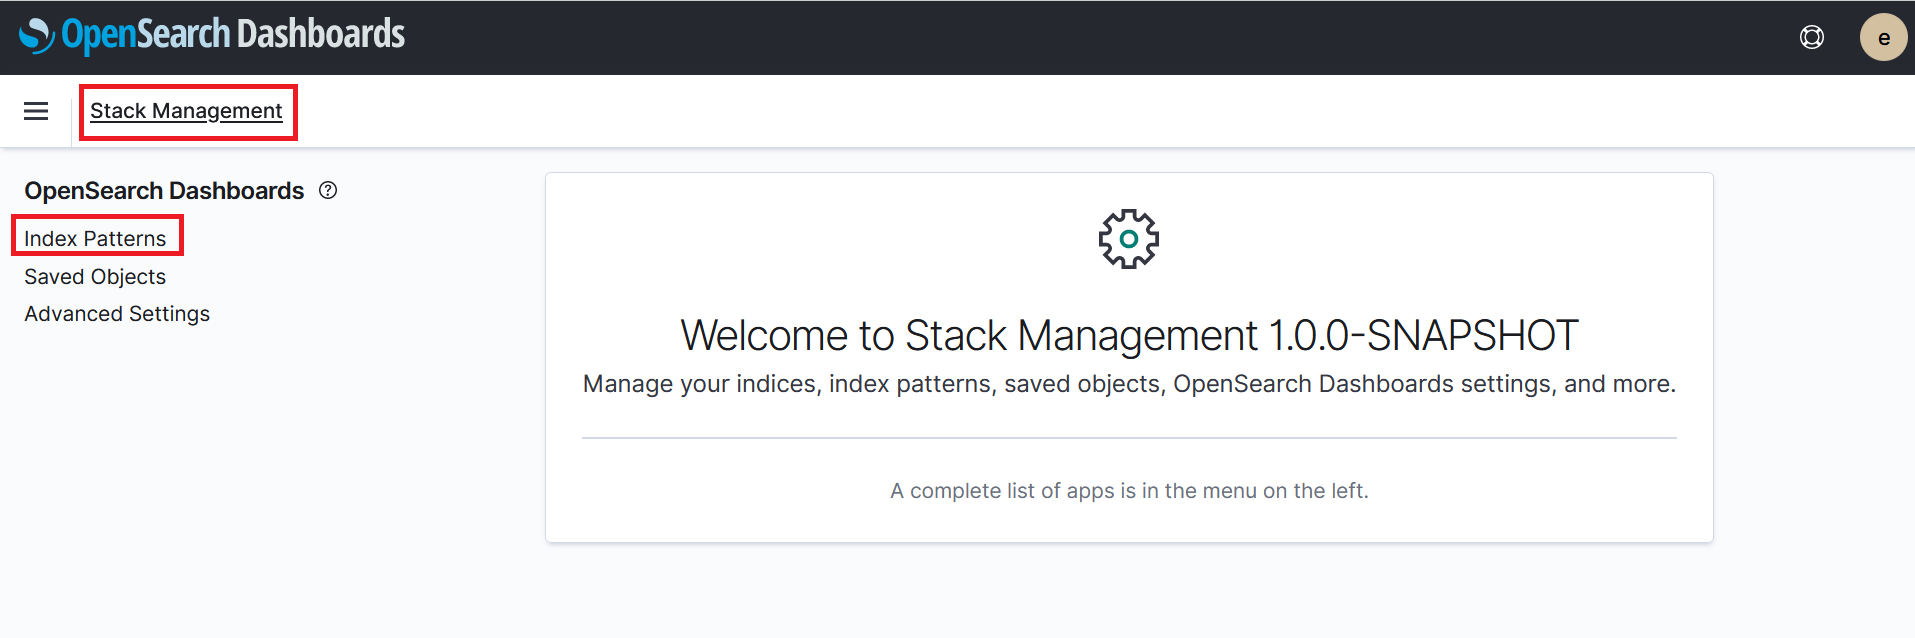
- On the index patterns page click on Create index pattern
- Enter
infa-logs-*under the index pattern name section
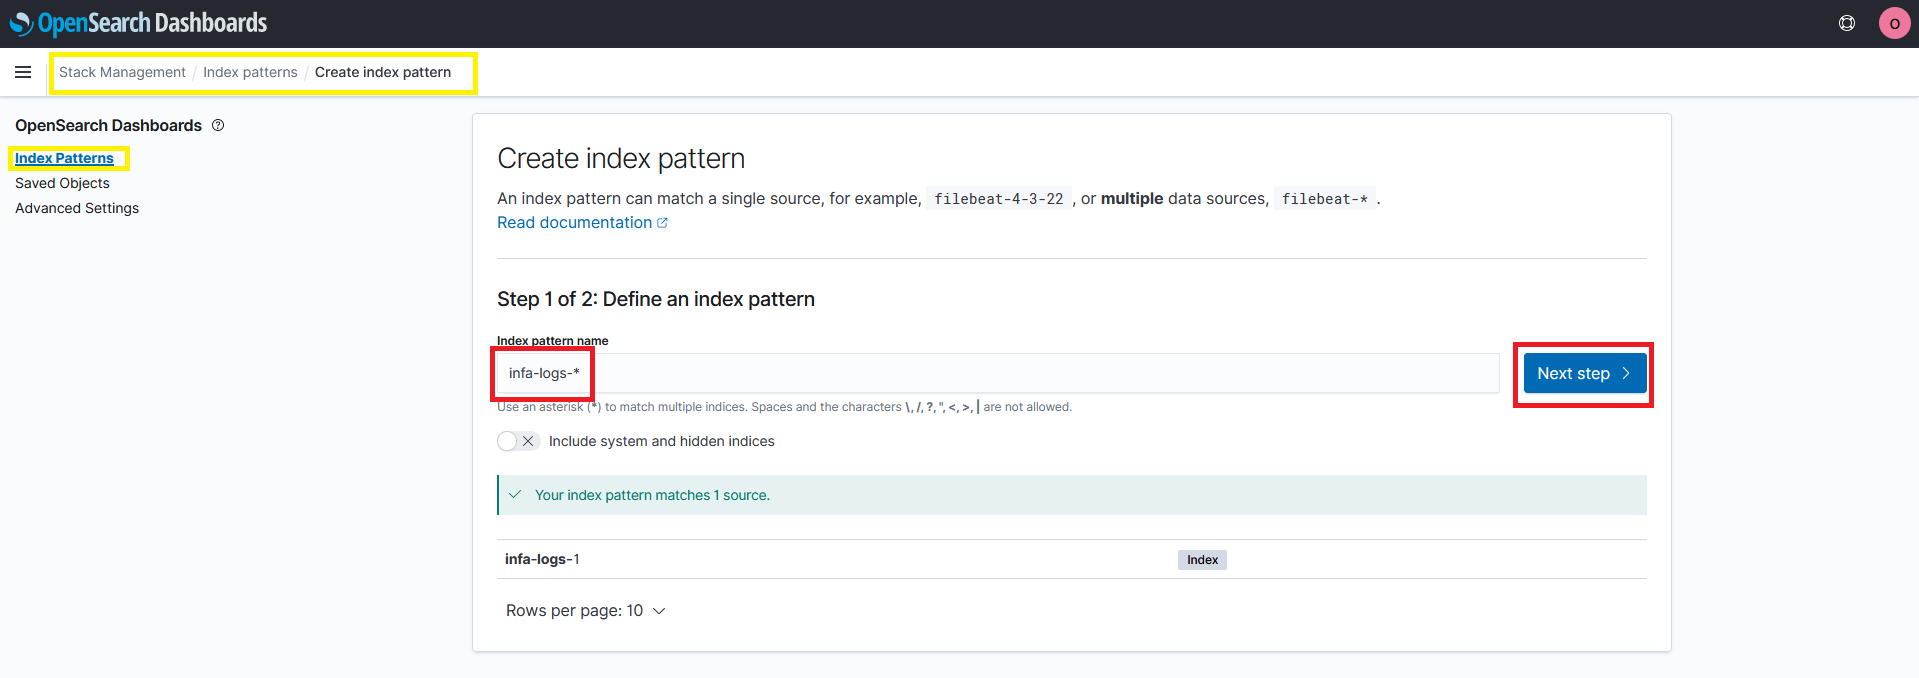
- Click on Next step
- Click on the time field drop down and select eventtime
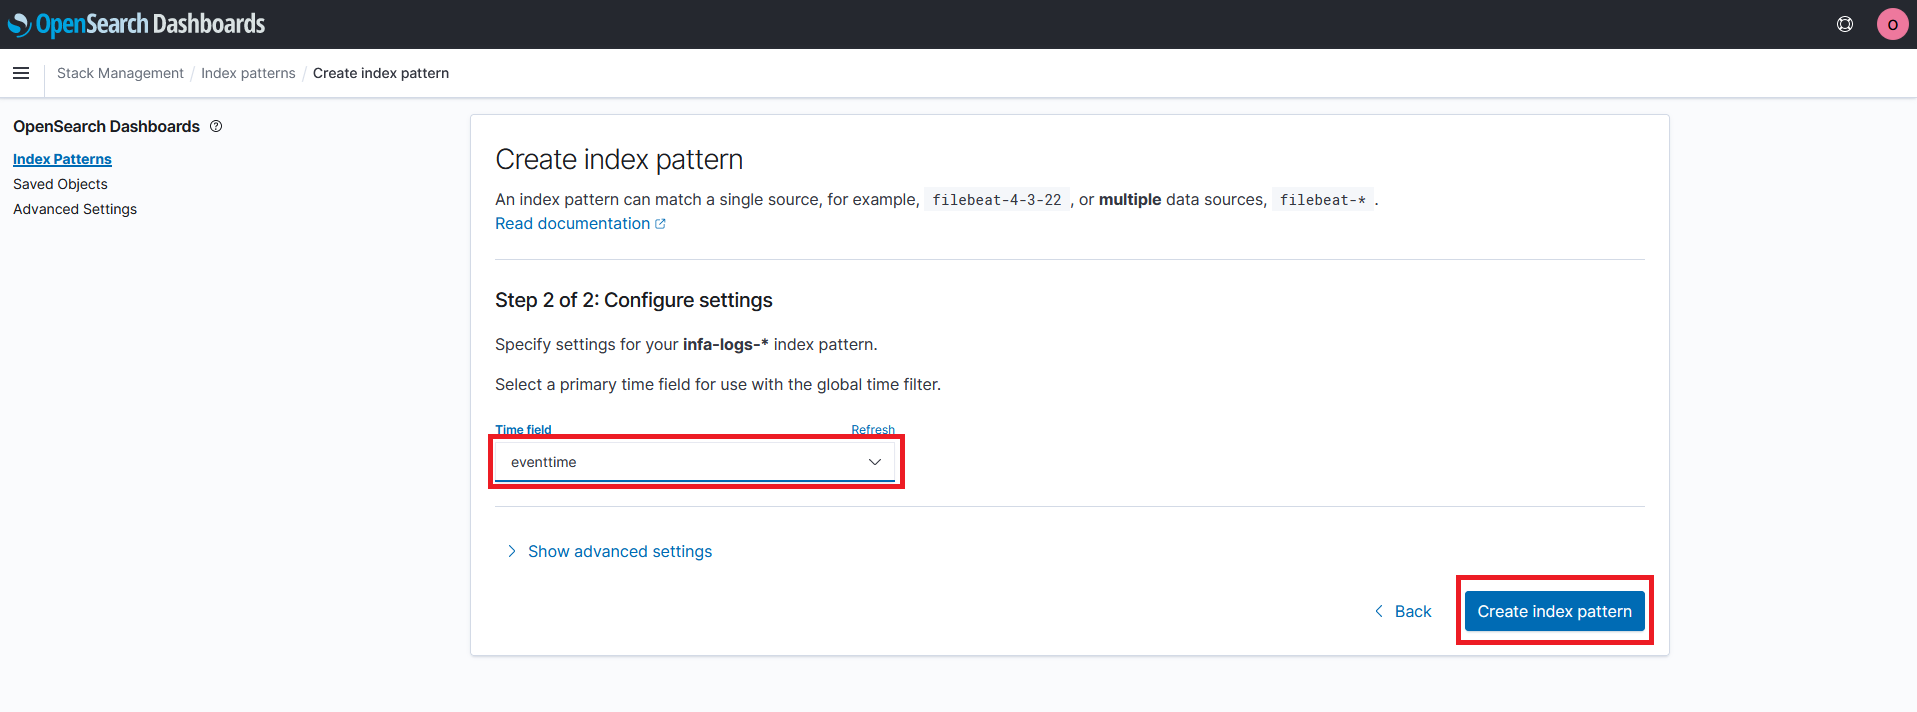
- Click on Create index pattern
You have now created an index pattern! You can use the index pattern to search our log and validate that the logs have been send from MSK to OpenSearch
Step 2 - Search Logs
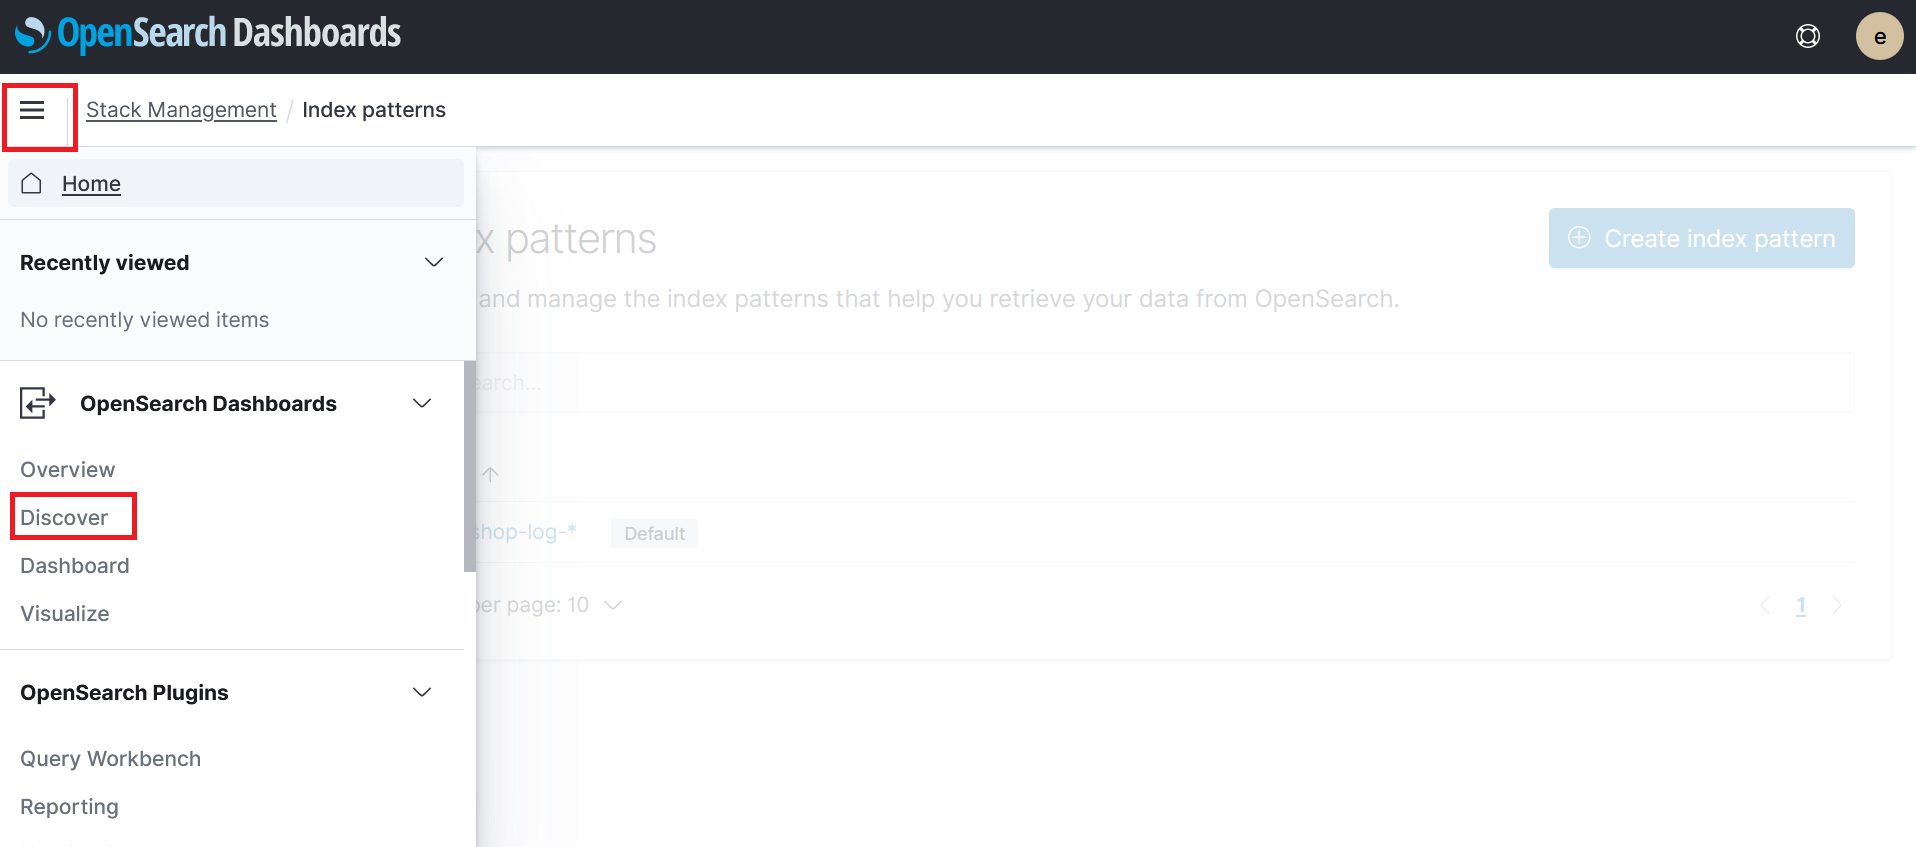
- In the OpenSearch Dashboard expand the side menu and click on Discover under the OpenSearch Dashboards section
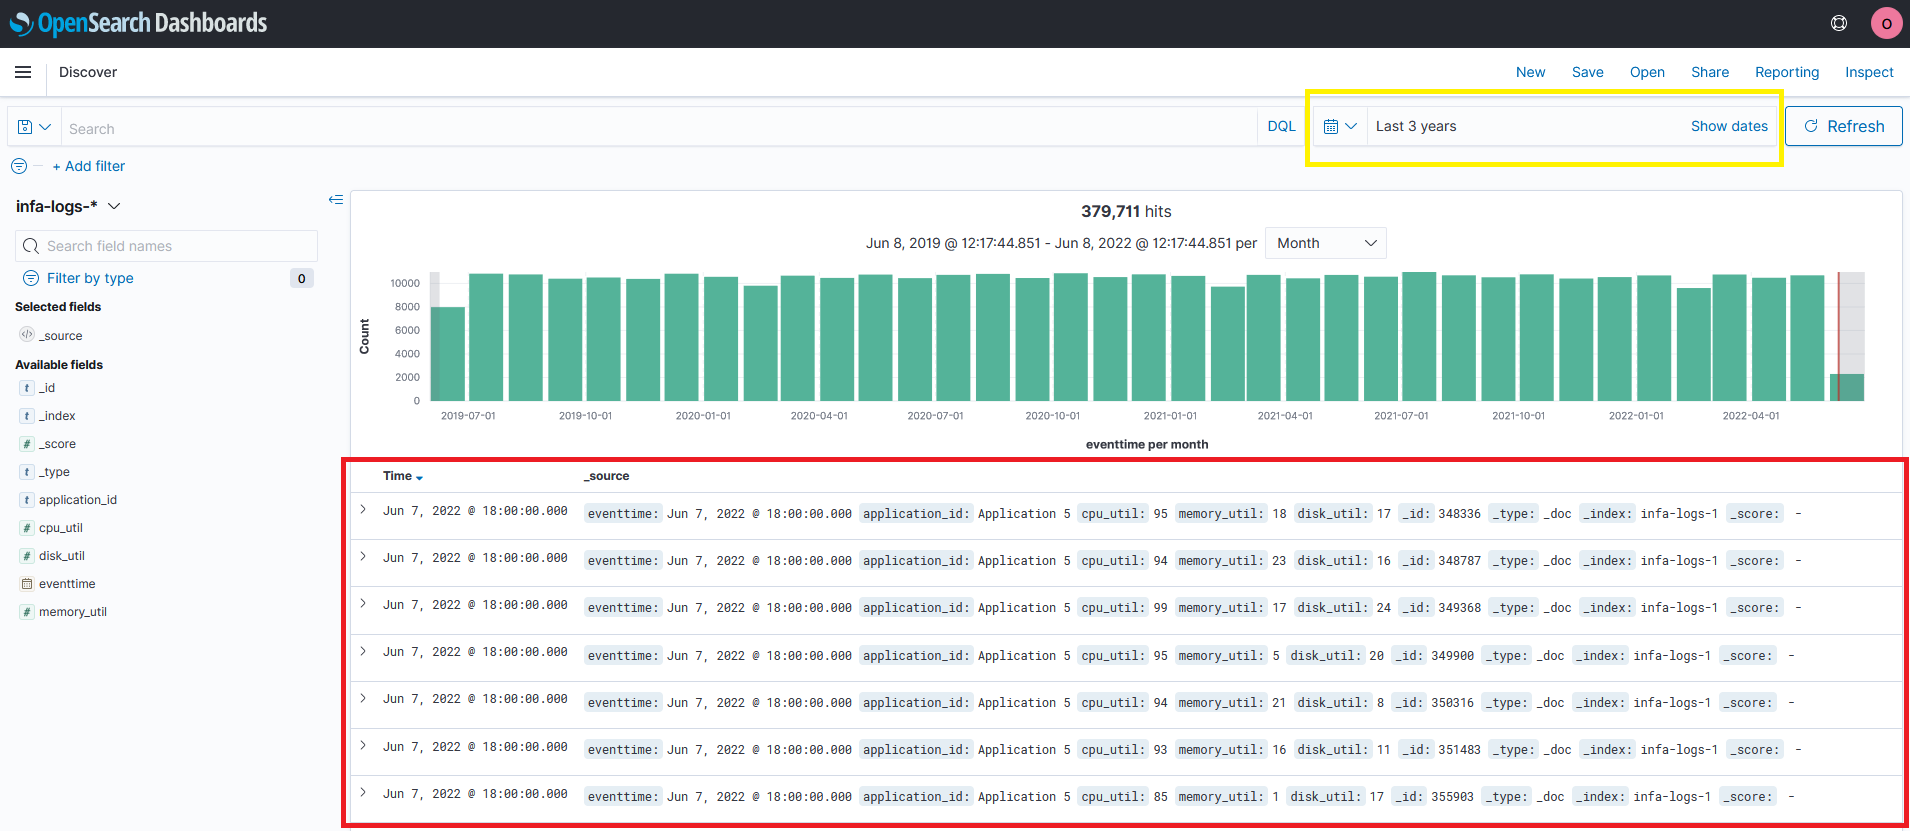
- Expand the time range that OpenSearch will view to the Last 3 year
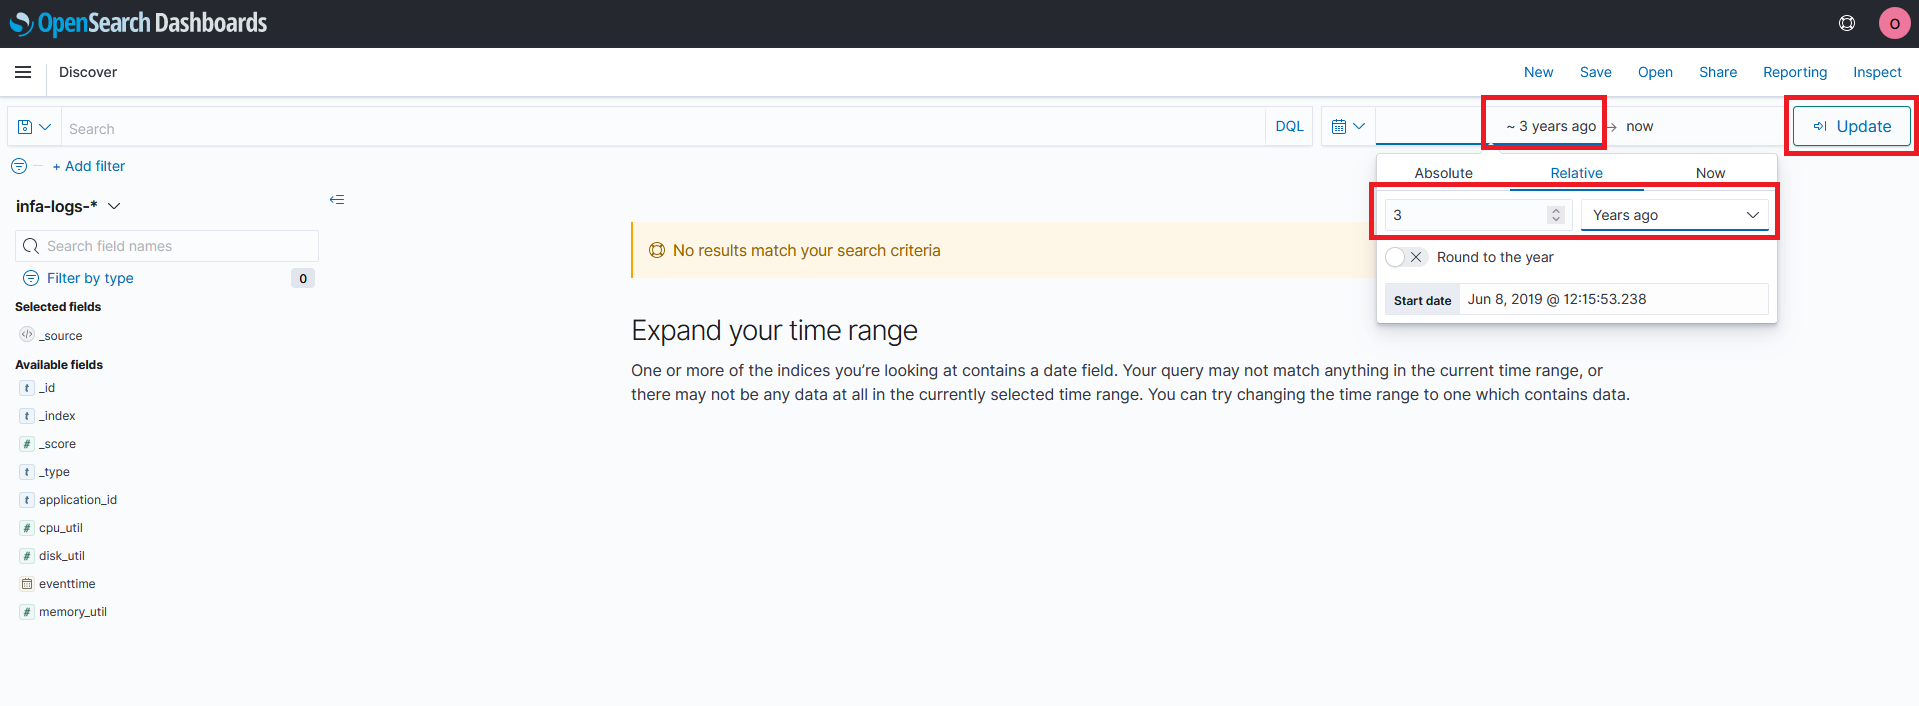
You will now be able to see logs from the past 3 yrs
Step 3 - Create Anomoly Detector
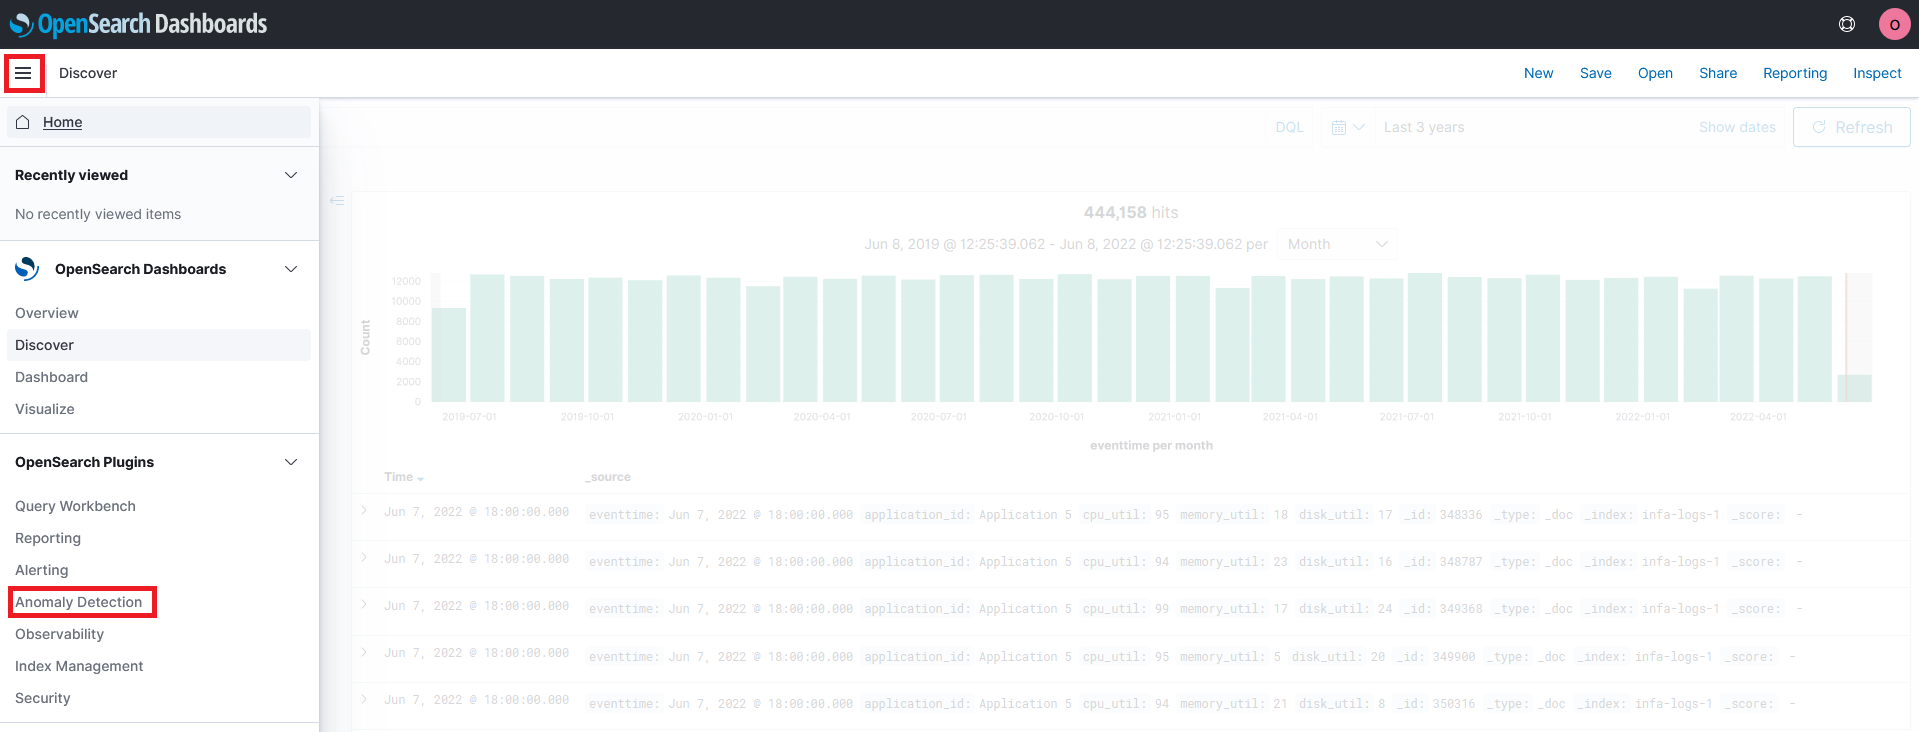
- In the OpenSearch Dashboard expand the side menu and click on Anomaly detection under the OpenSearch Plugins section
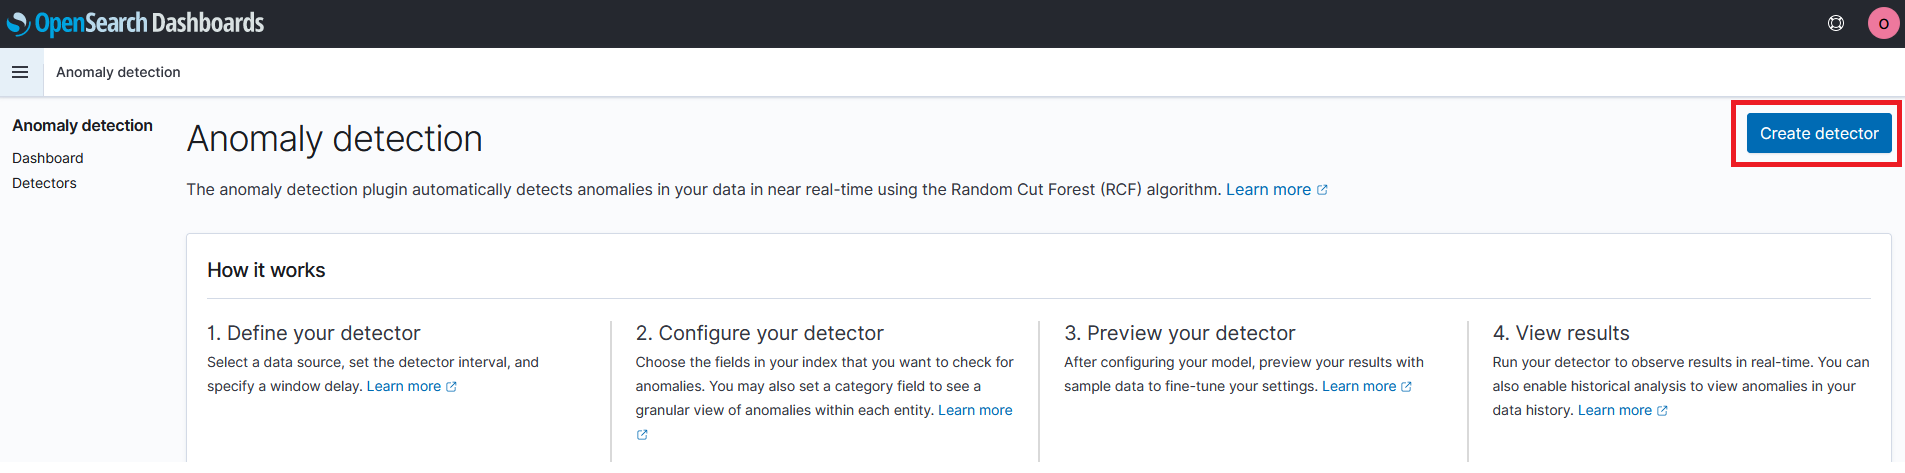
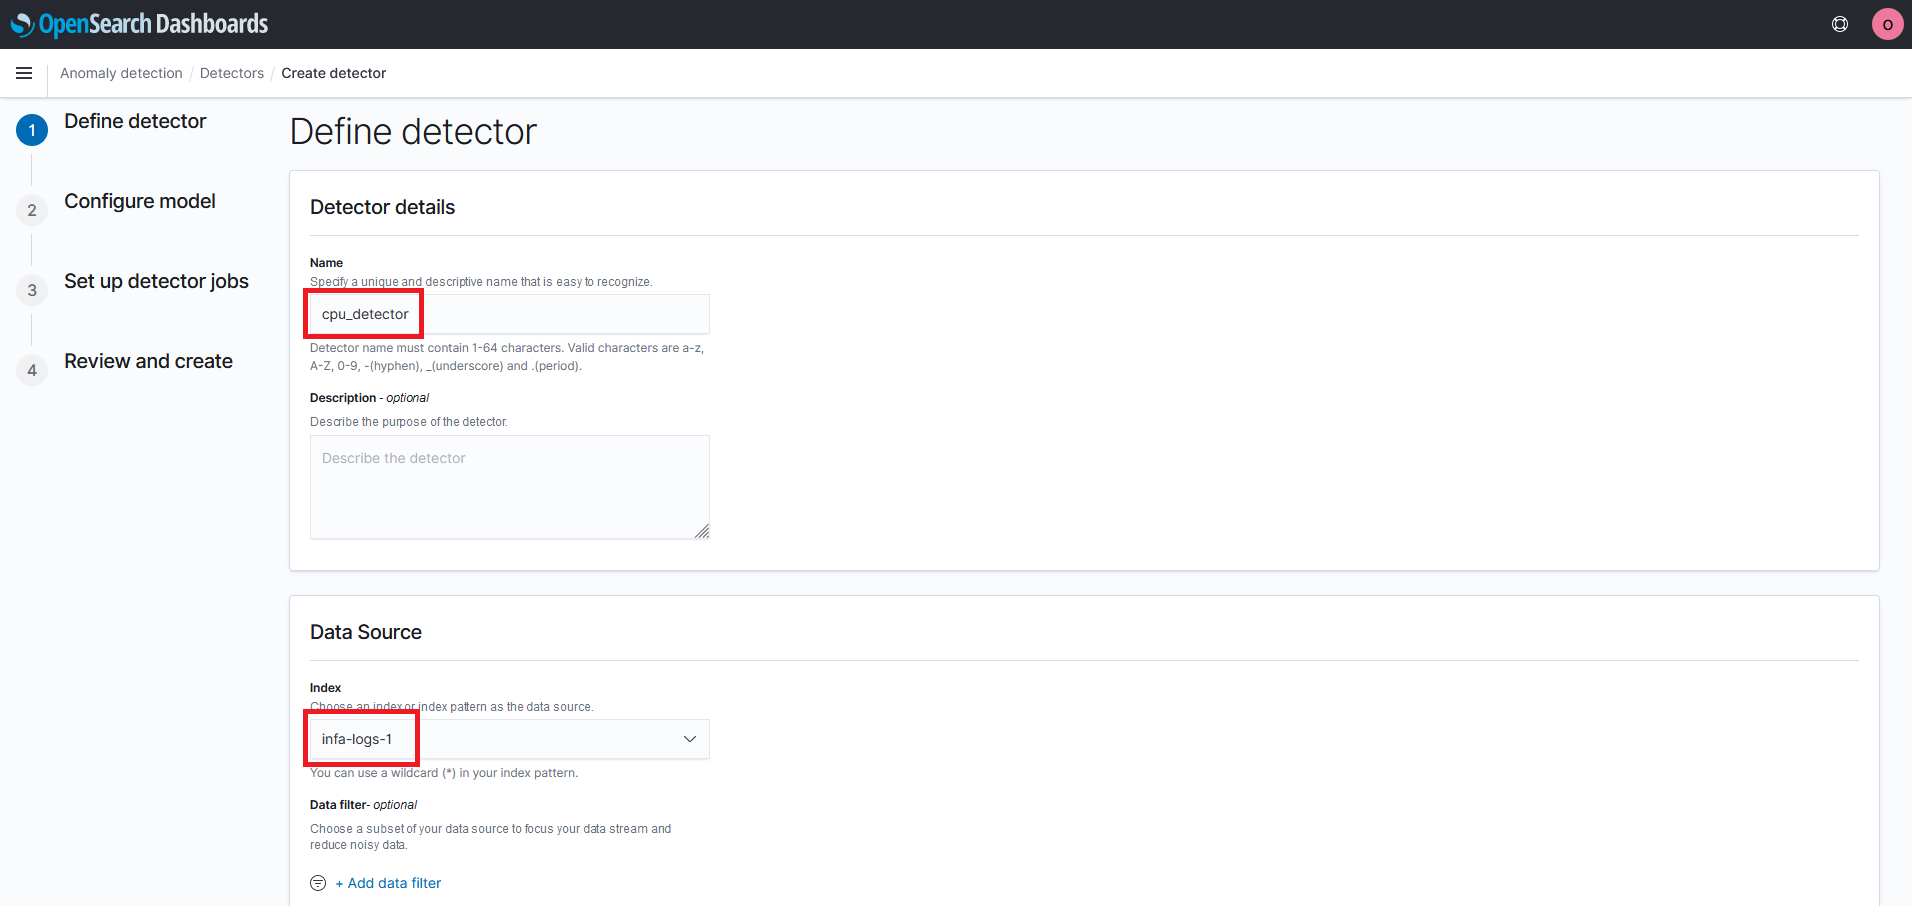
- Click on Create detector
- Enter
cpu_detectorfor the name of the detector - Pick
infa-logs-1for the data source of the detector
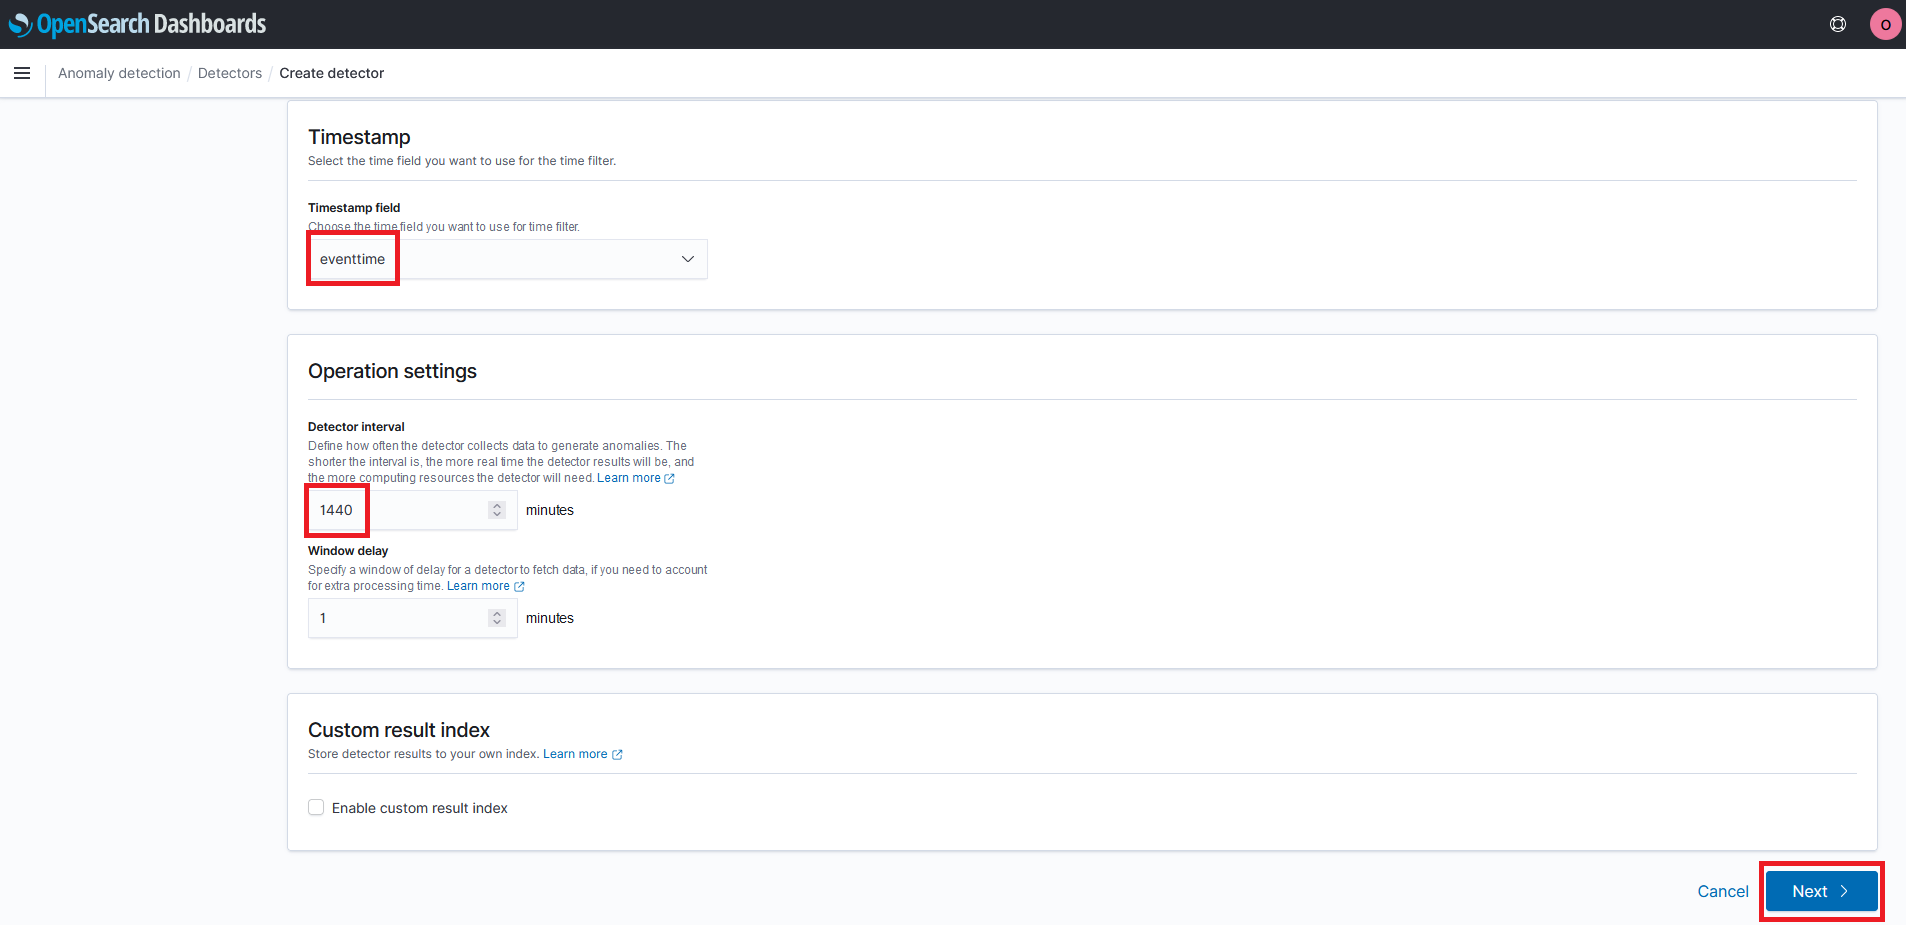
- Pick
eventtimefor the timestamp of the detector - Change the detector interval to
1440 - Click on Next
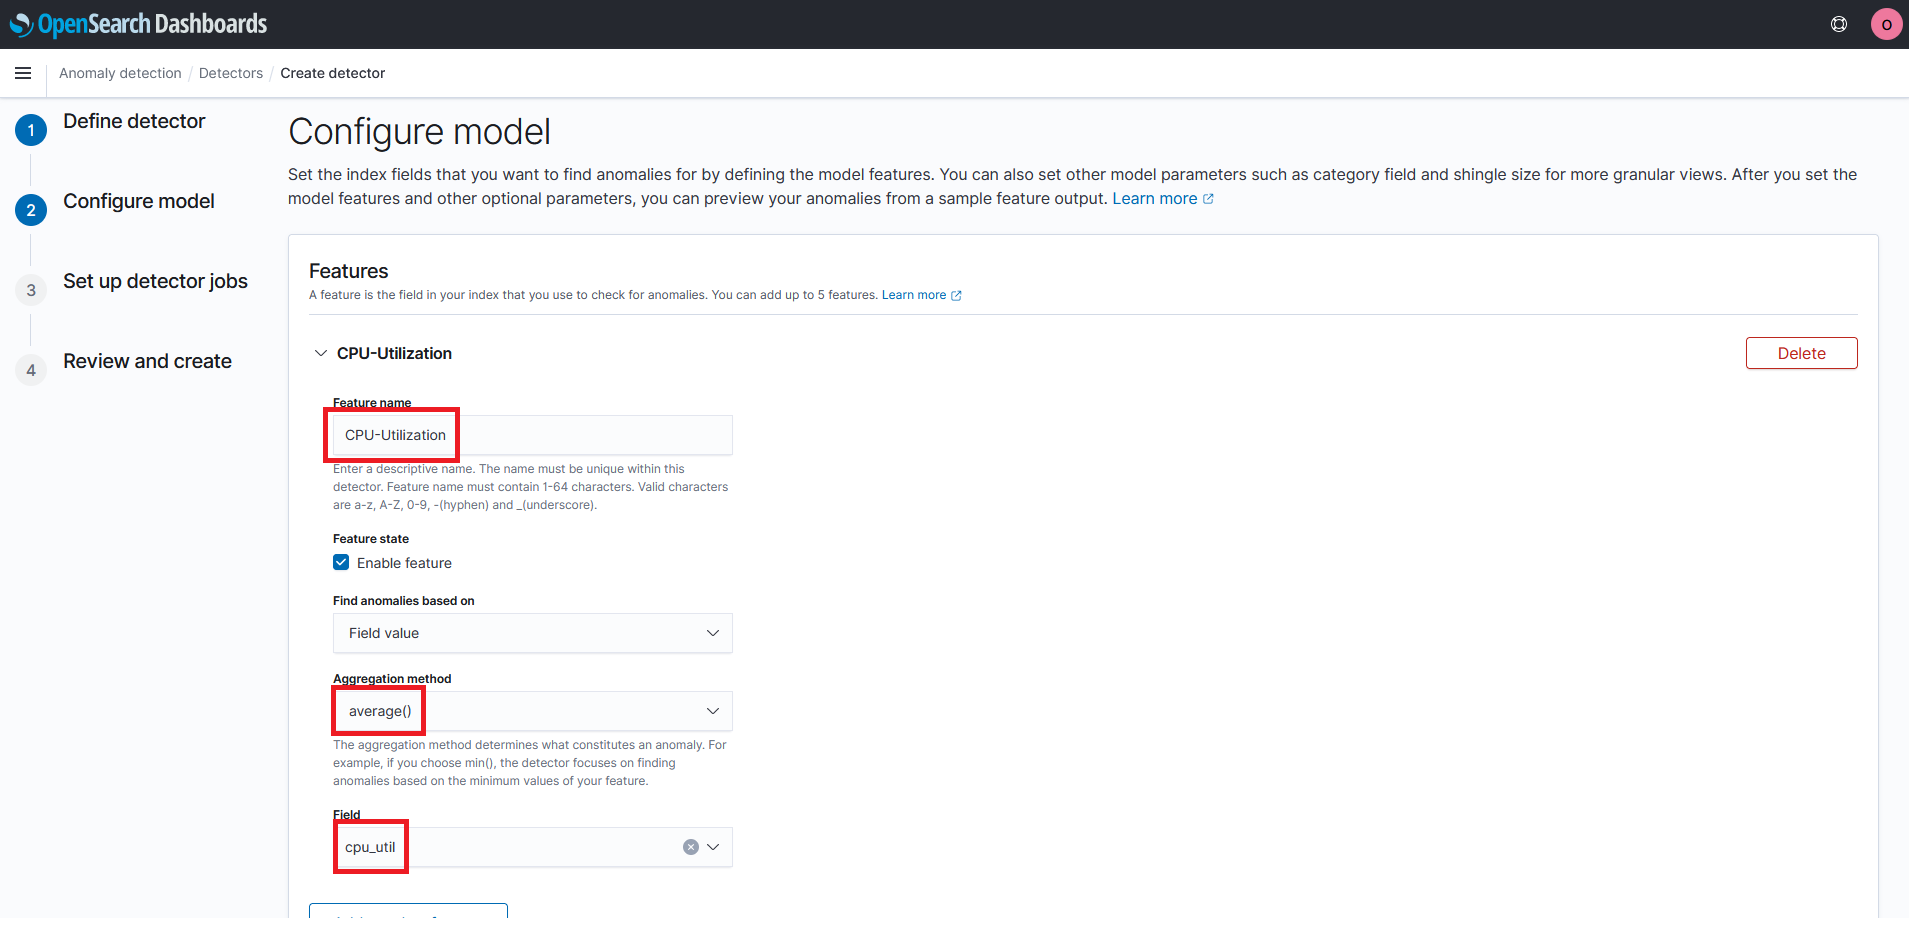
- Enter
CPU-Utilizationfor the feature name - Select
average()for the aggregation method - Select
cpu_utilfor the field
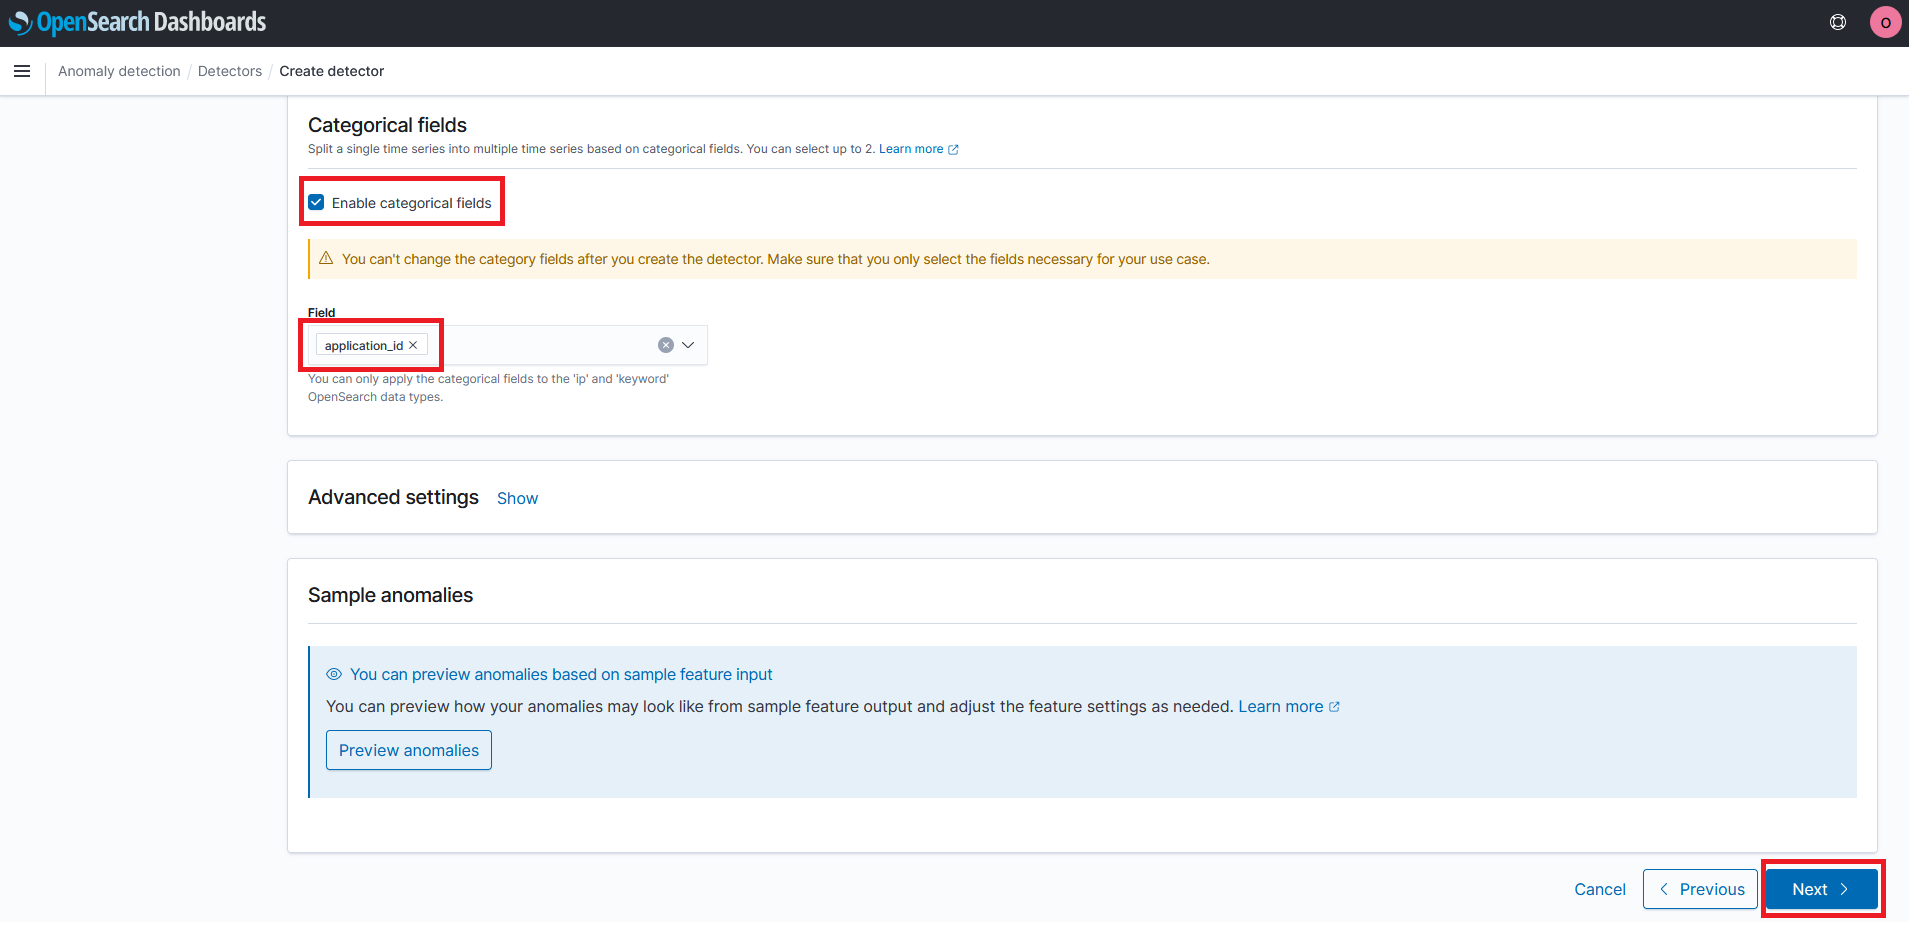
- Click the check box to enable categorical fields
- Select
application_idfor the categorical field - Click on Next
- Click to uncheck the box to start real-time detector automatically
- Click the check box to run historical analysis detection
- Adjust the historical analysis date range to the last 3 yrs
- Click on Apply
- Click on Next
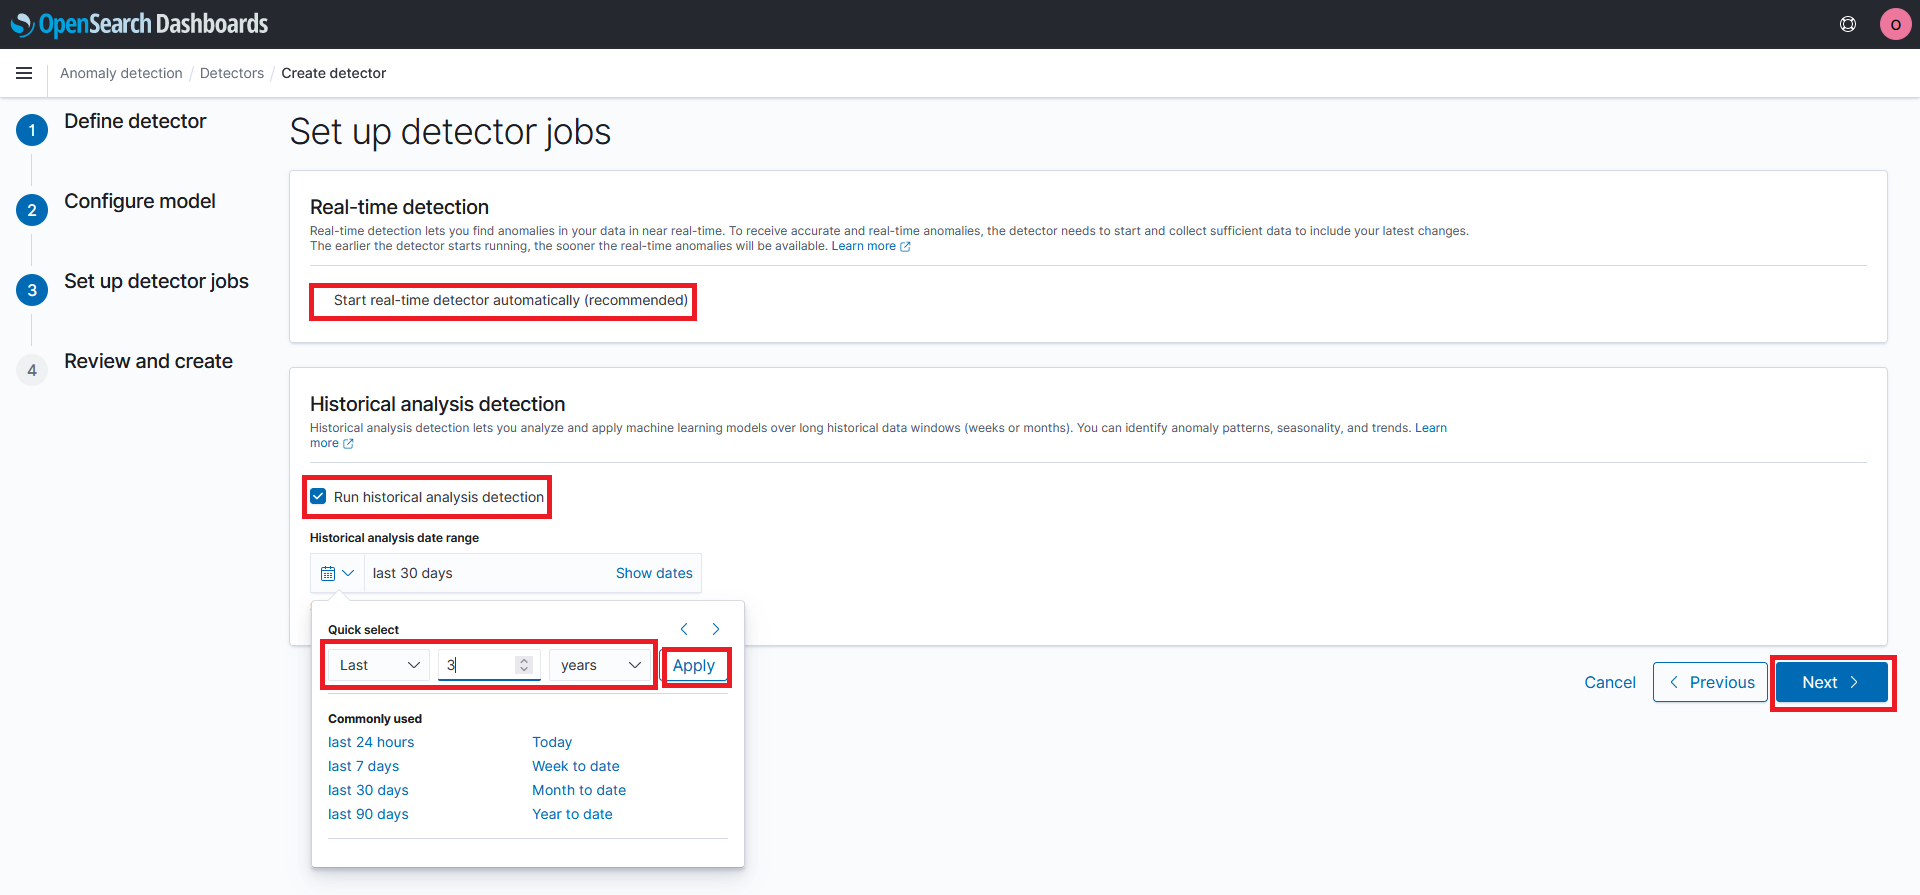
- Click on Create detector
Step 4 - View Anomaly Detector Results
- Click on the Historical analysis tab
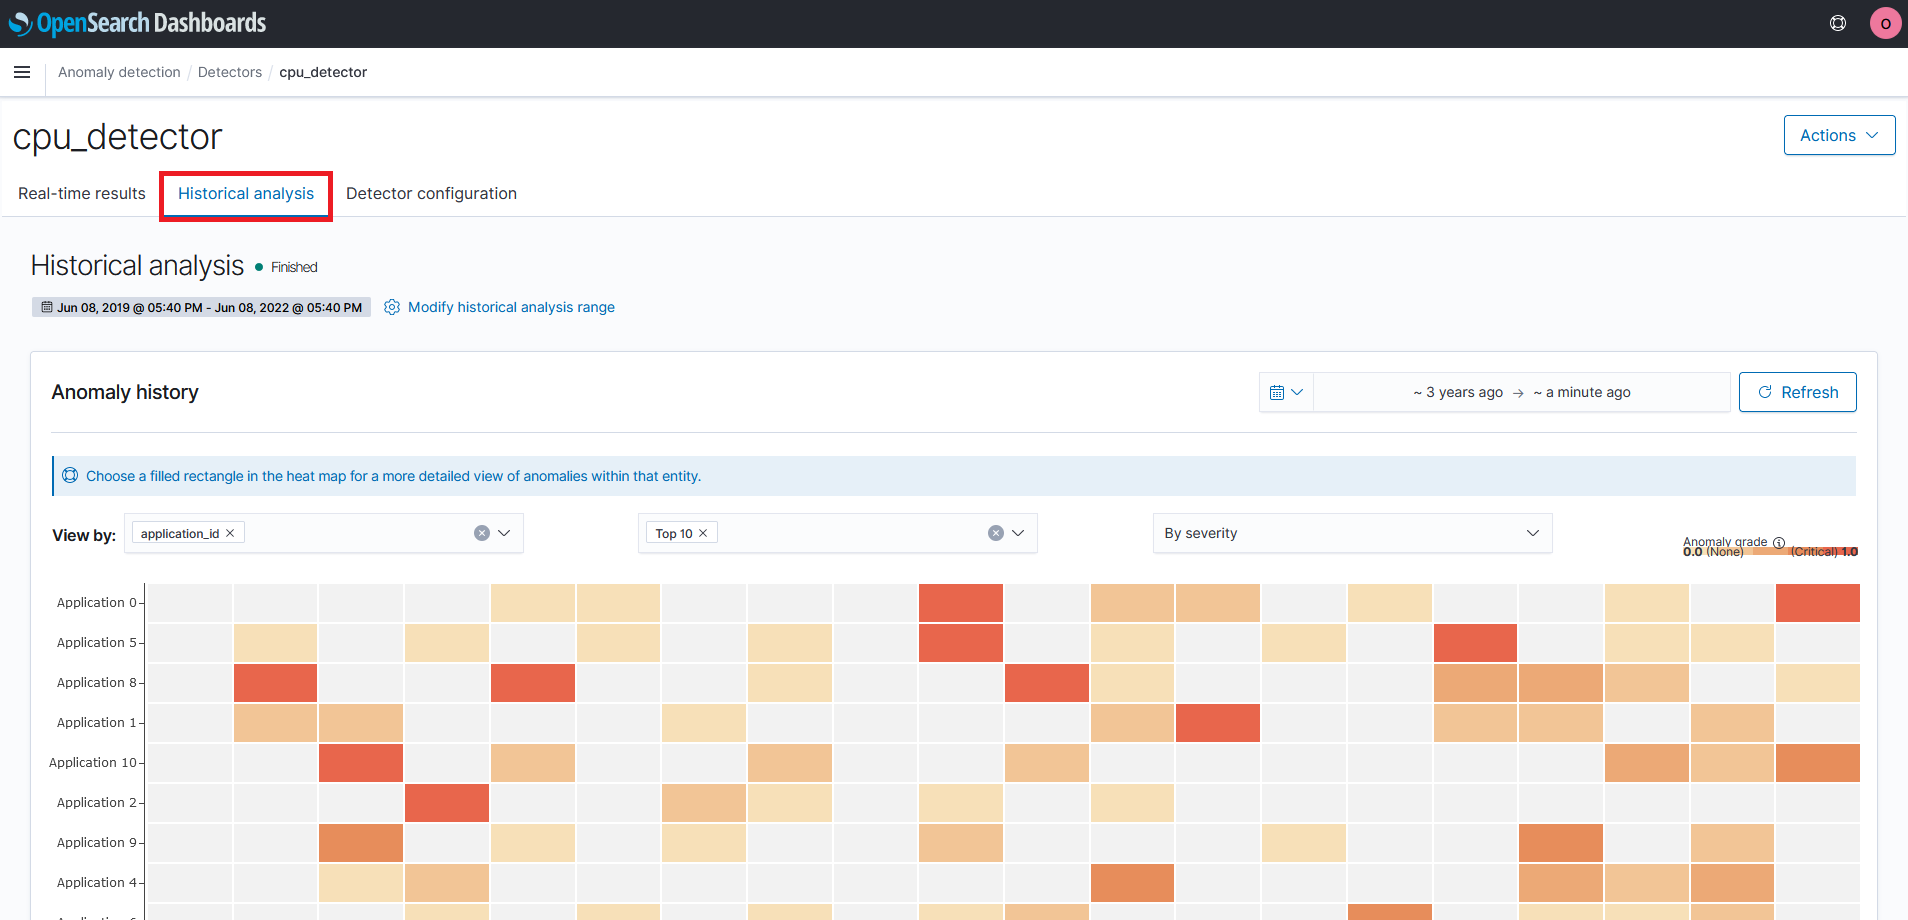
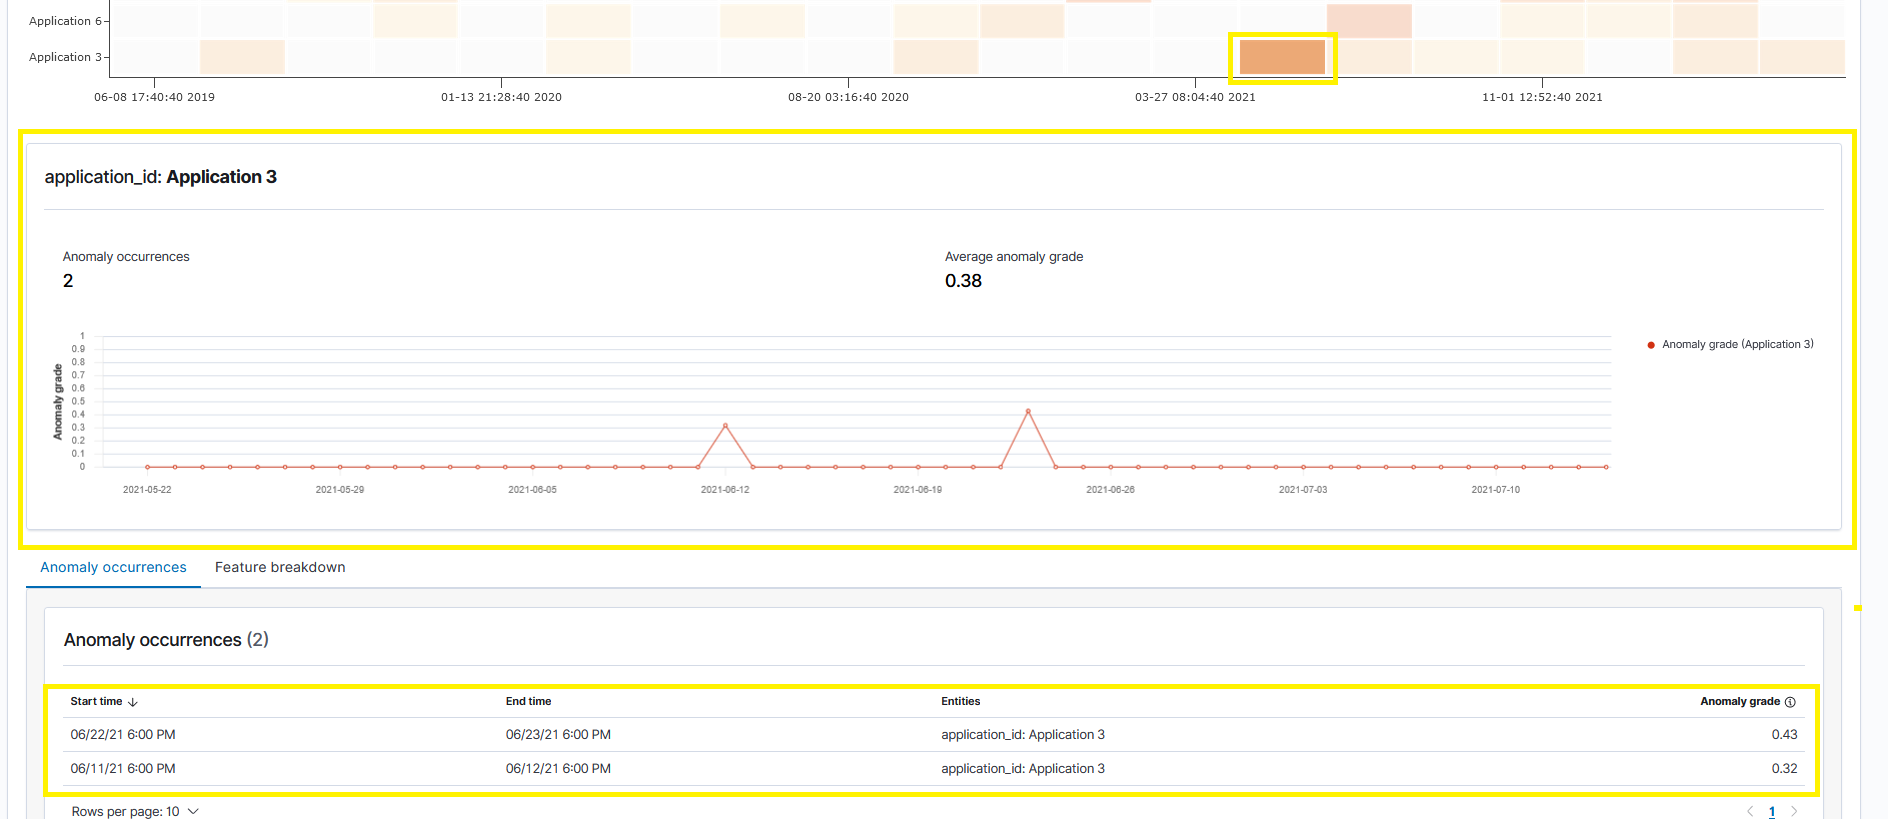
You will now be able to see a heat map of the anomaly’s detected by application. Click on an of the rectangles in the heat map to see a more detailed view of the anomaly
When you are ready proceed to the next step Clean Up if you want to delete the resources we used for this workshop