4. Visualize and Analyze
OpenSearch provides us the ability to analyze out logs. Let’s begin by navigating to the OpenSearch Dashboard
Open the OpenSearch Dashboard
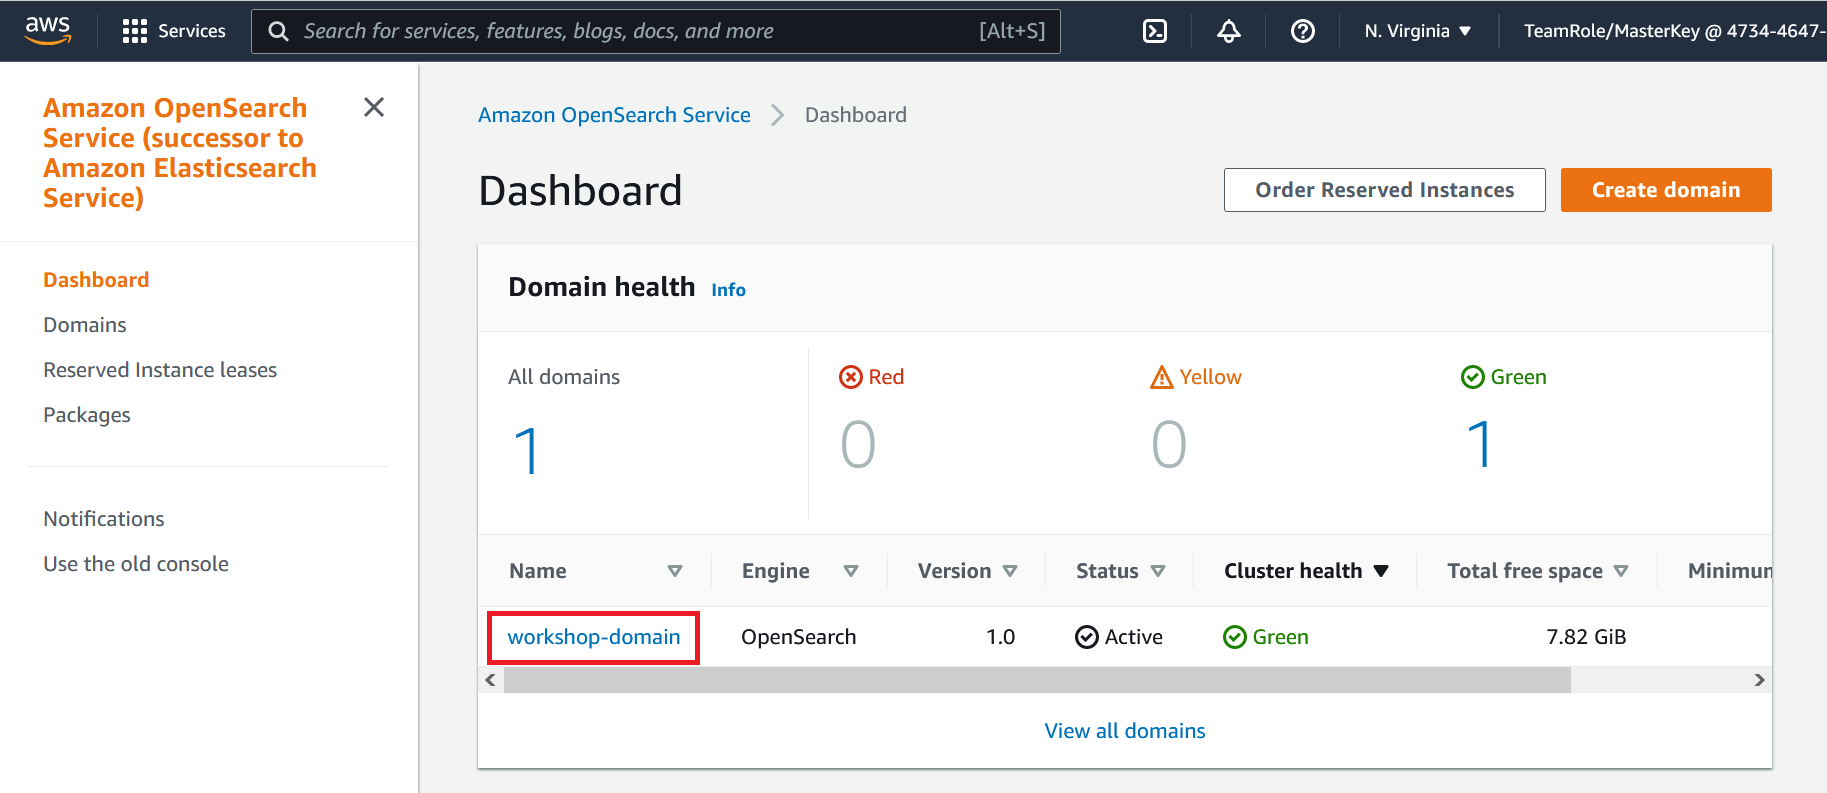
- Go to the OpenSearch Console
- Click on the workshop-domain OpenSearch domain you created earlier
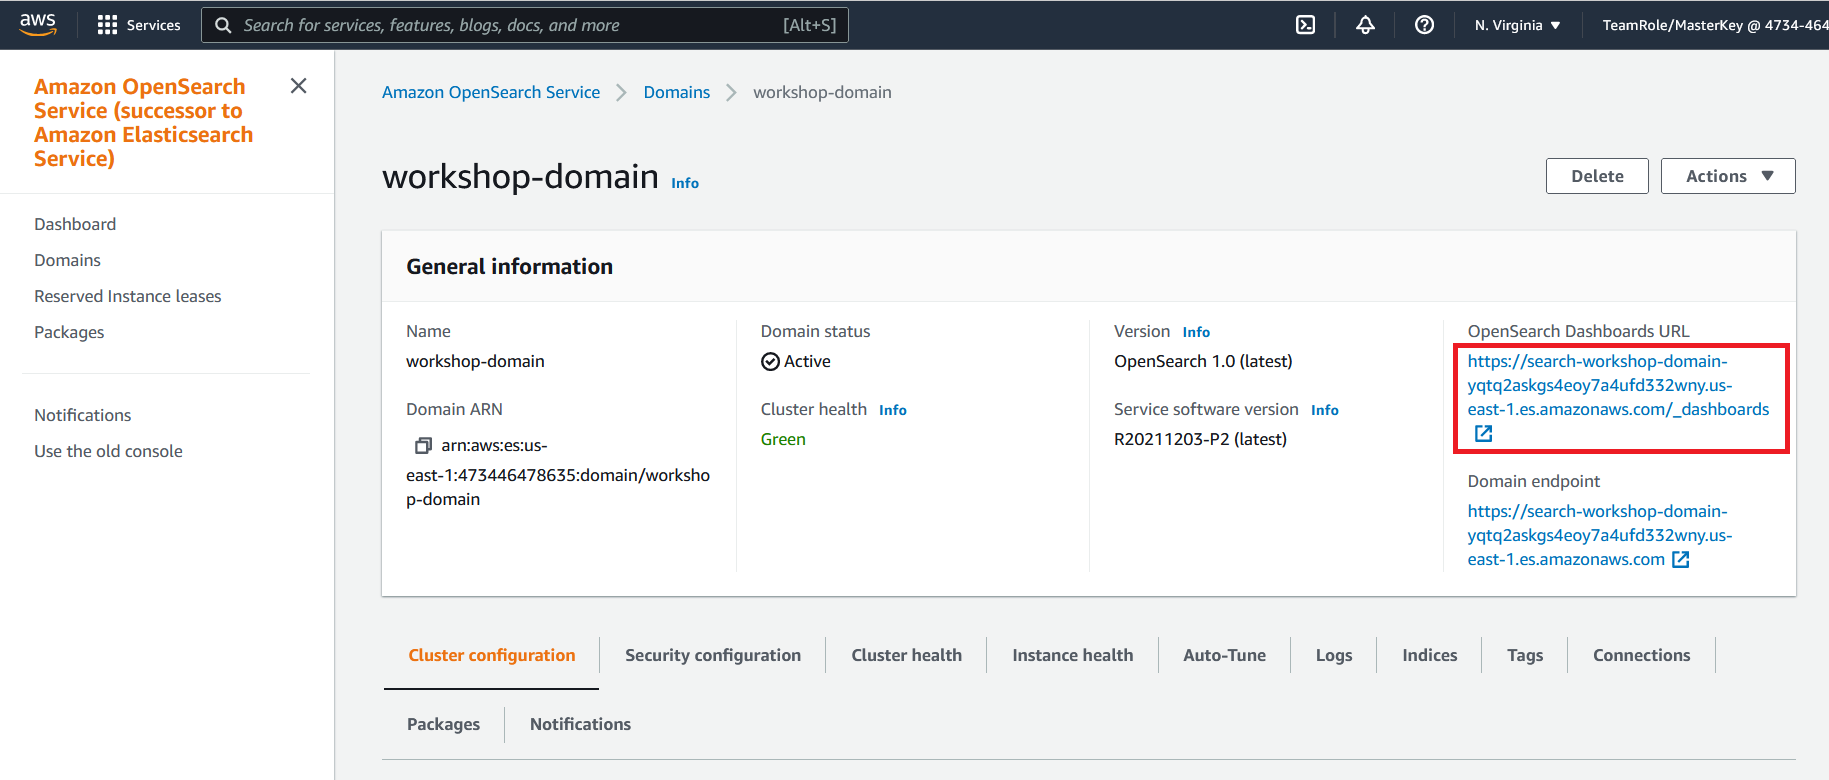
- Click on the OpenSearch Dashboard URL. This should open the URL in a web browser window
- You will be prompted to log in. For the user name enter
OSMasterUserfor the password enterAwS#OpenSearch1 - If an additional popup window is present after login asking about data upload click on Explore on my own
- If an additional popup windows is present asking you to select your tenant select Global and click on Confirm
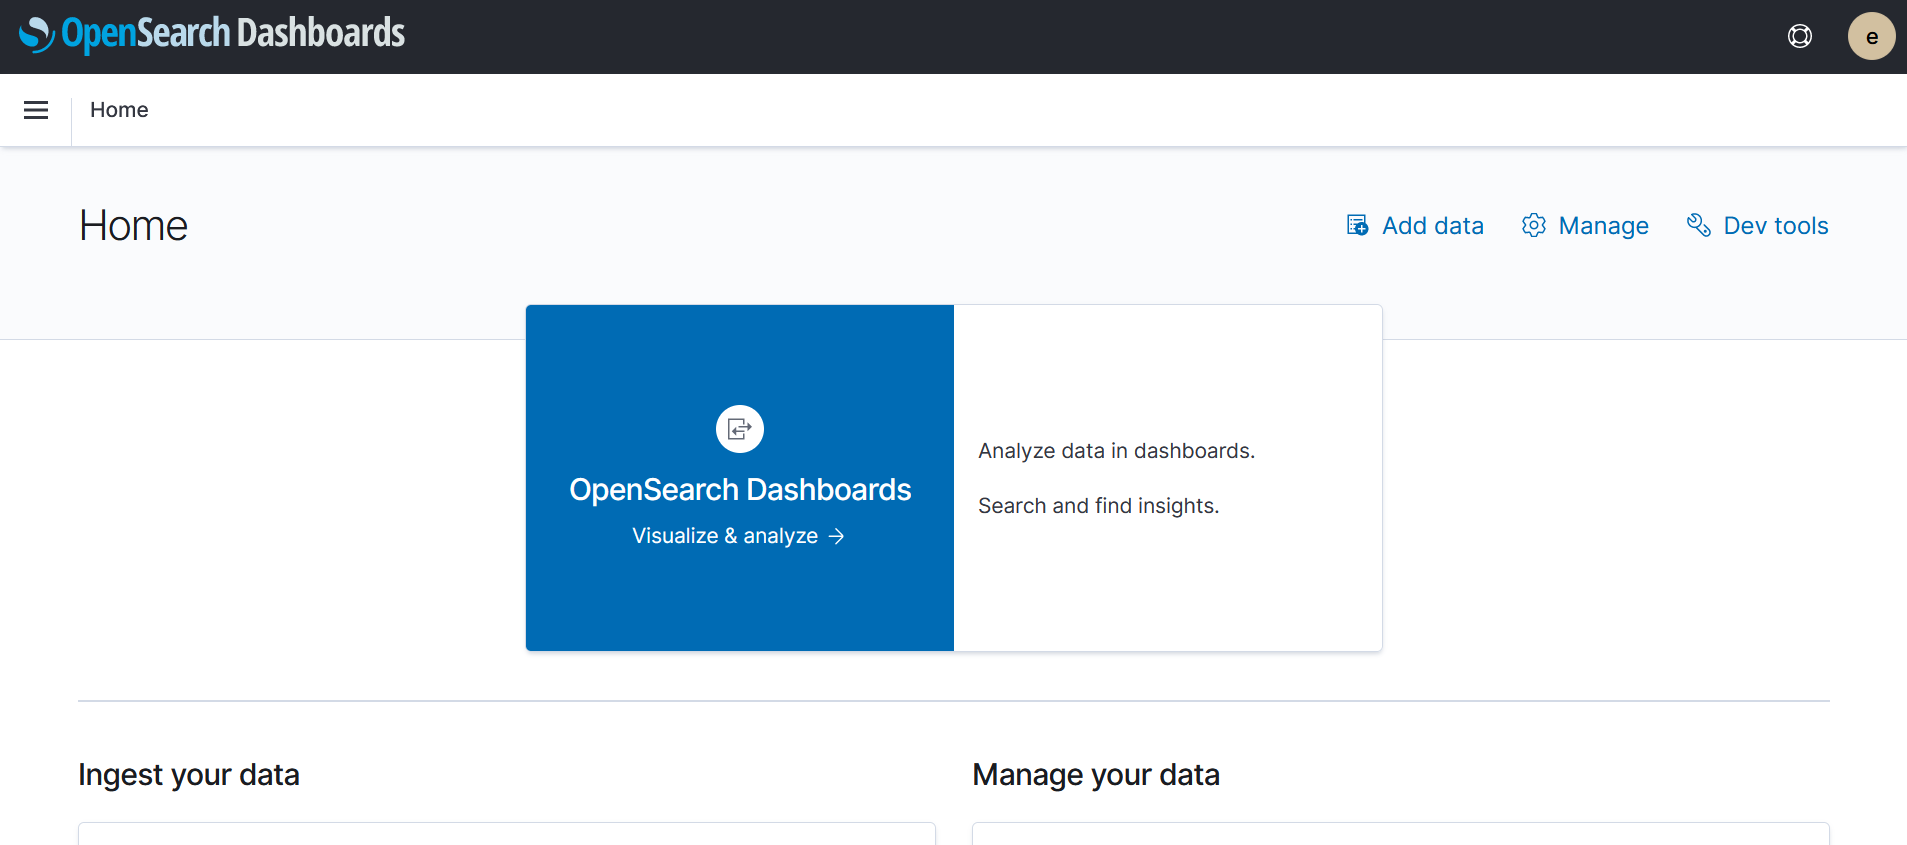
You should now see a window that looks like this
Create an Index Pattern
When we deployed Kinesis Data Firehose we configured it to create a new index in OpenSearch every 1 hr. We also configured it to name each index starting with workshop-log
This means that open search will have 1 index for each hour it is sent logs, and that these indices' names will start with workshop-log
In order to work with all of the logs (ie. multiple hours) we will create an index pattern in OpenSearch. The index pattern will be a representation of all of the workshop-log indexes for all of the hours
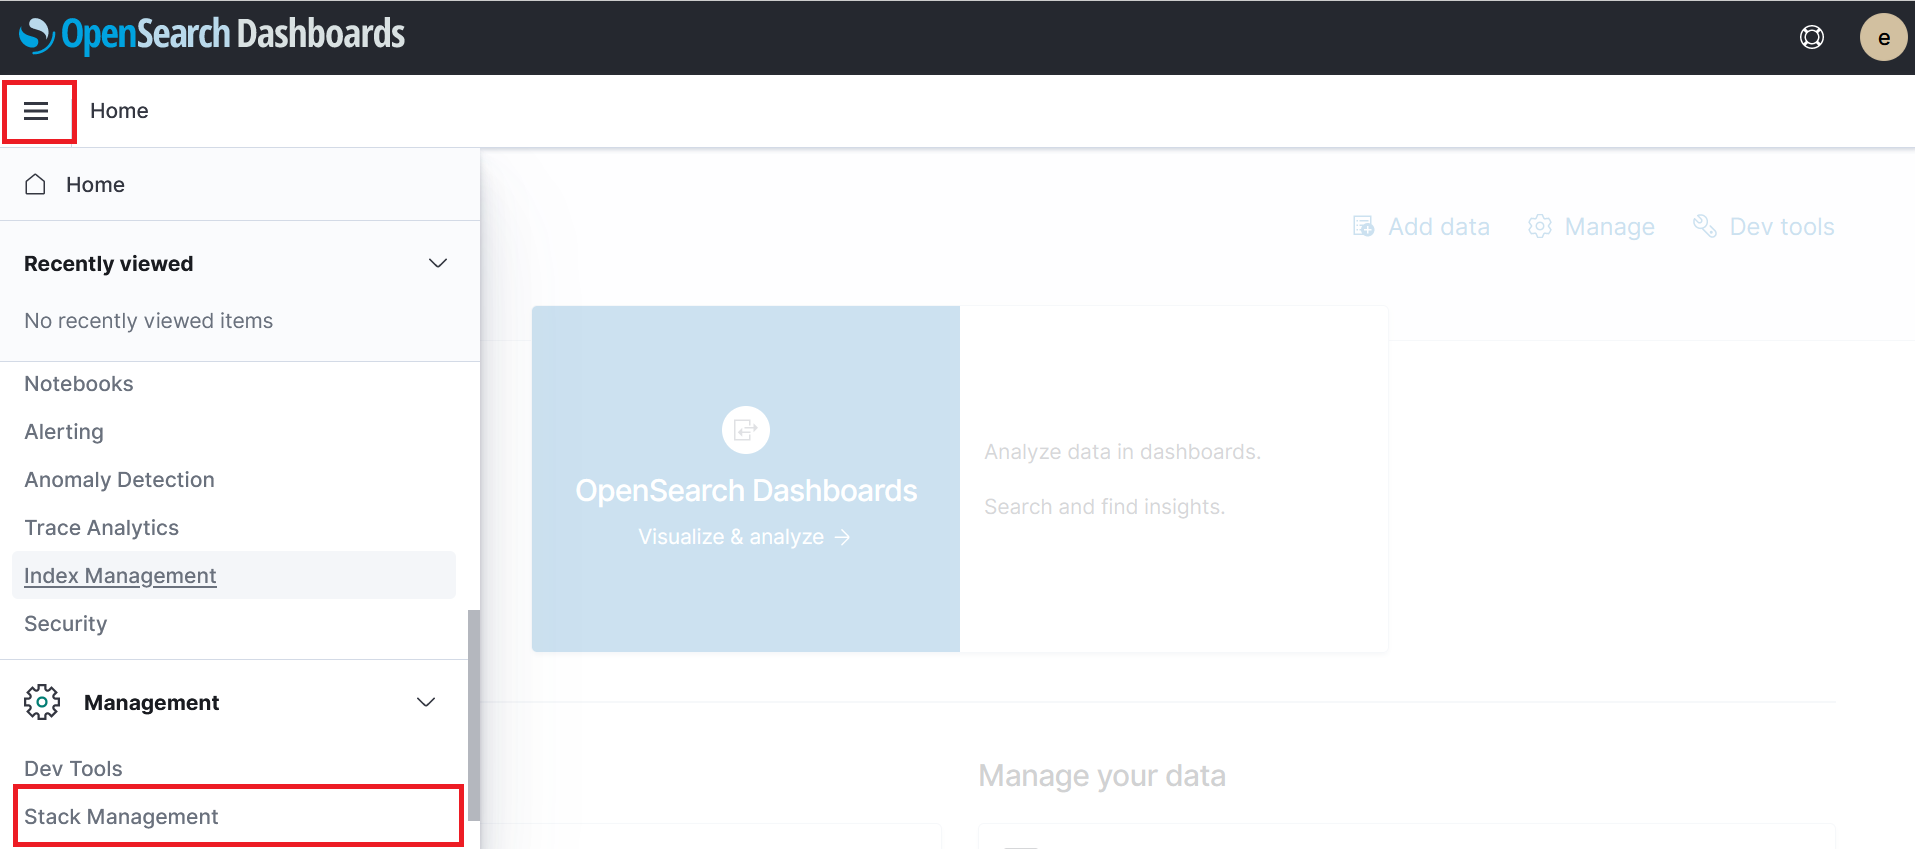
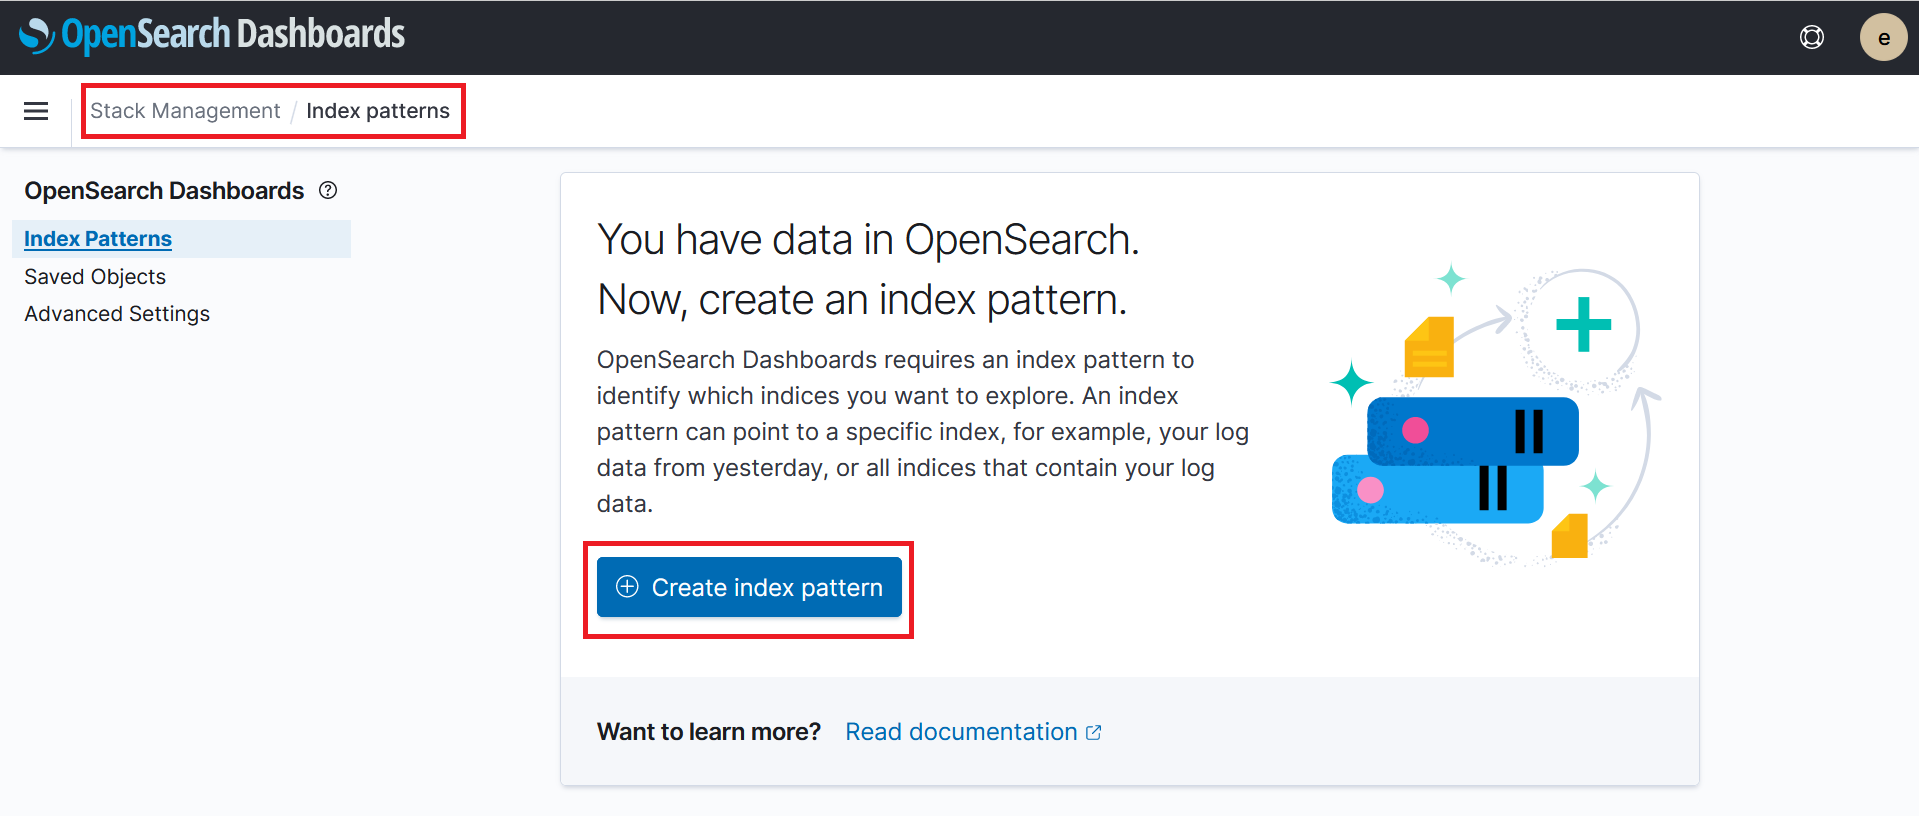
- In the OpenSearch Dashboard, expand the side menu and click on Stack Management under management section
- On the stack management page click on Index Patterns on the left hand menu
- On the index patterns page click on Create index pattern
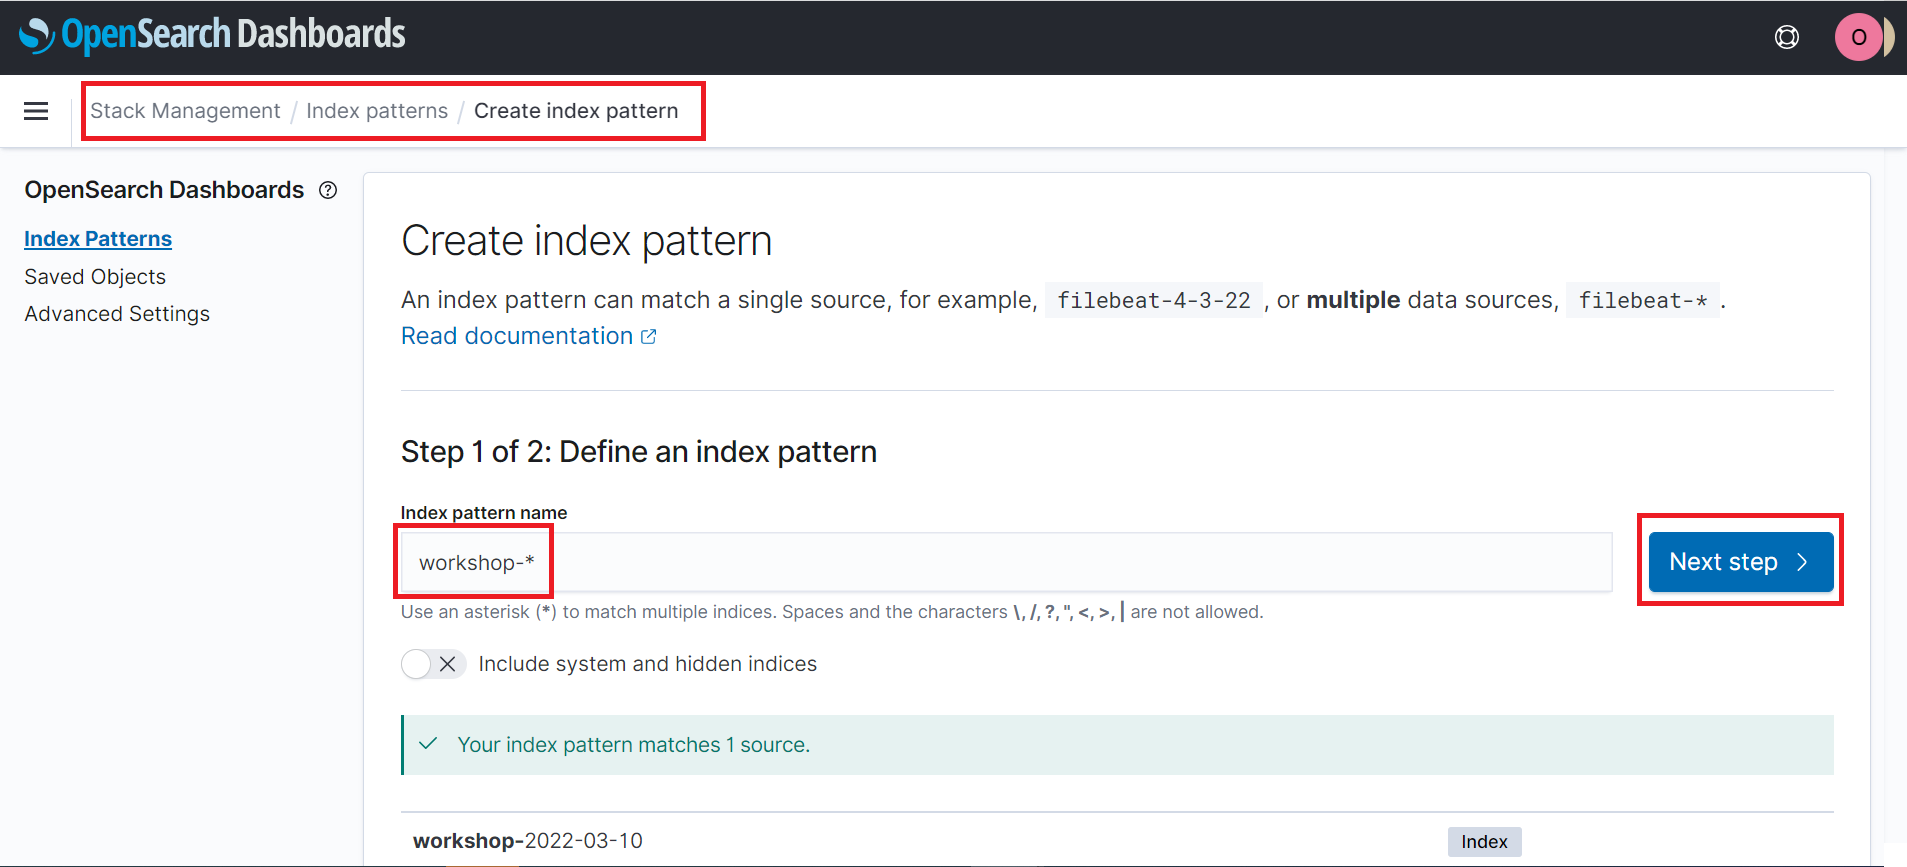
- Enter
workshop-*under the index pattern name section - Click on Next step
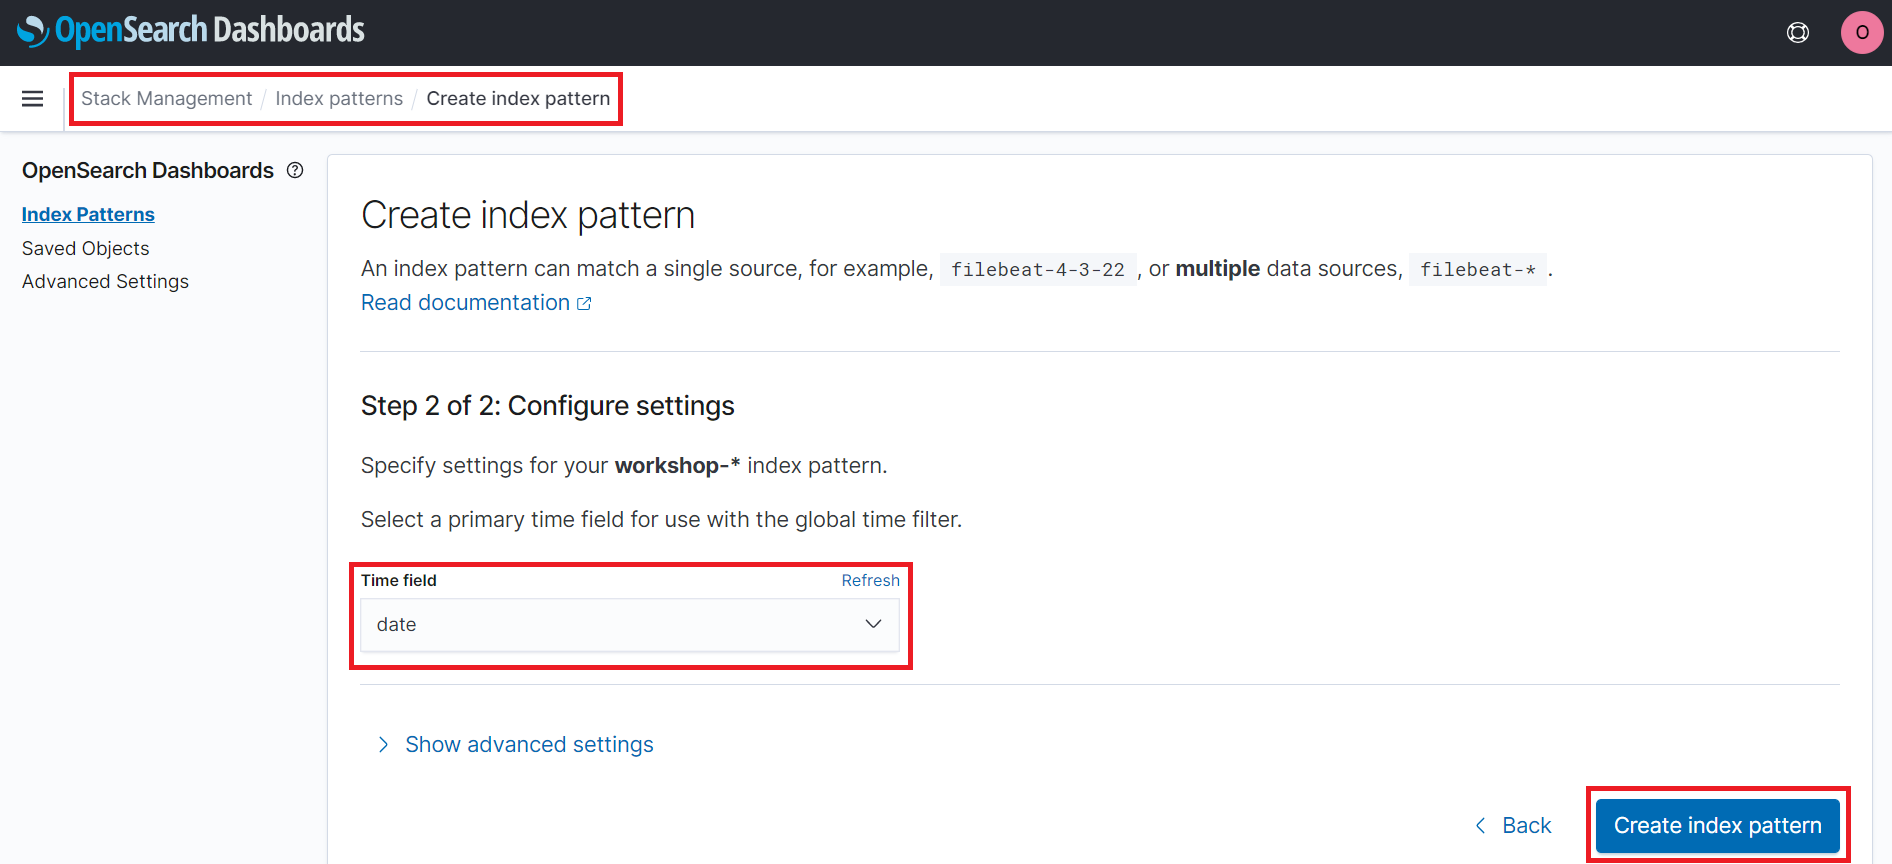
- Select date as the time field
- Click on Create index pattern
We have now created an index pattern! We can use the index pattern to analyze our logs
Search the Logs
OpenSearch provides the ability to easily search log data. Let’s run a few simple searches on our logs
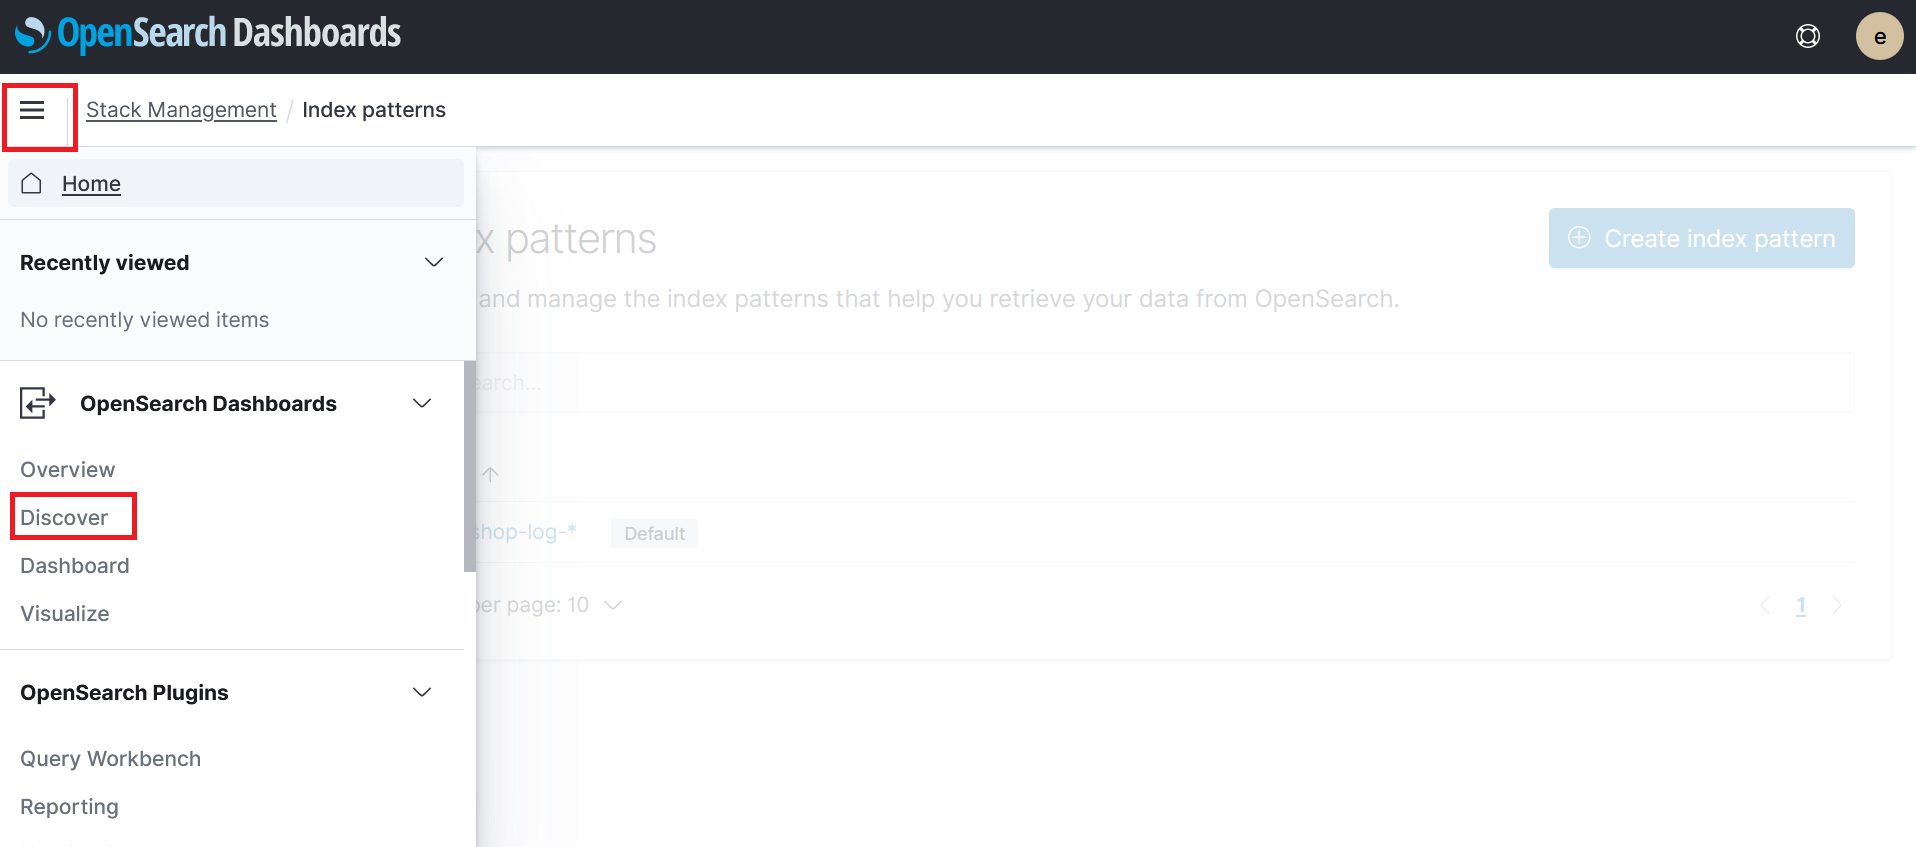
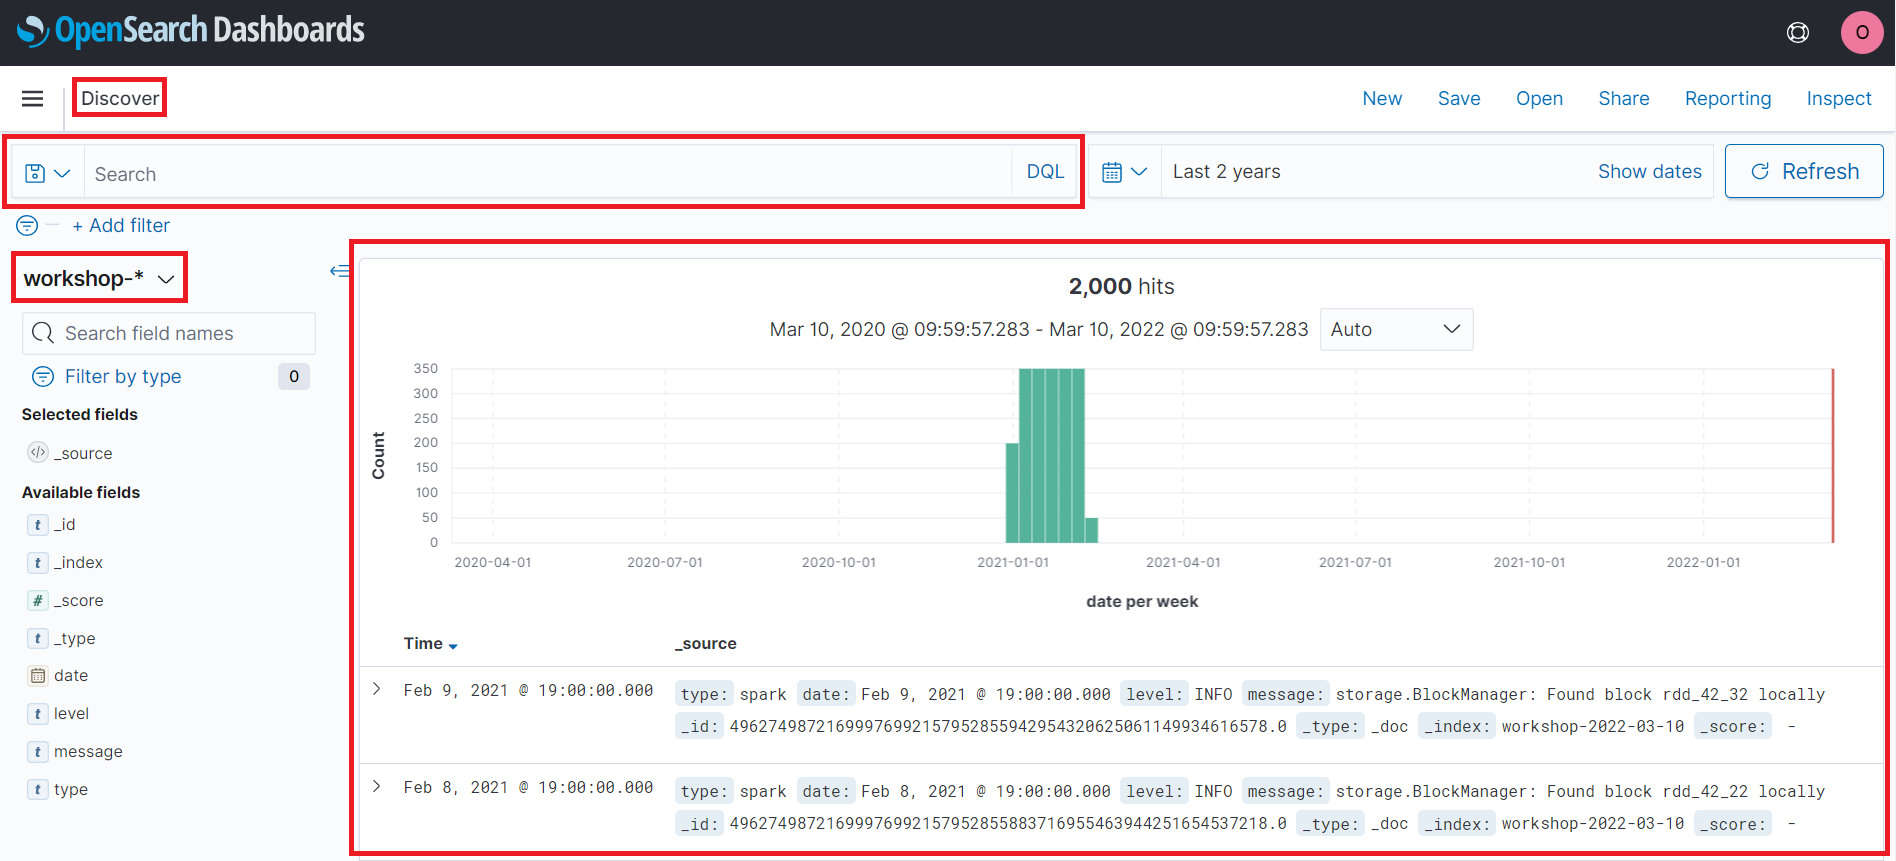
- In the OpenSearch Dashboard expand the side menu and click on Discover under the OpenSearch Dashboards section
This will bring you to the discovery page. By default this view of the log data views the last 15 minutes. Let’s adjust it to display the last two years of data.
- Click on date/time filter next to the search bar
- Configure the relative date range for 2 years
- Click on the Update
We can now see the log data we sent via. the Cloud9 Python application
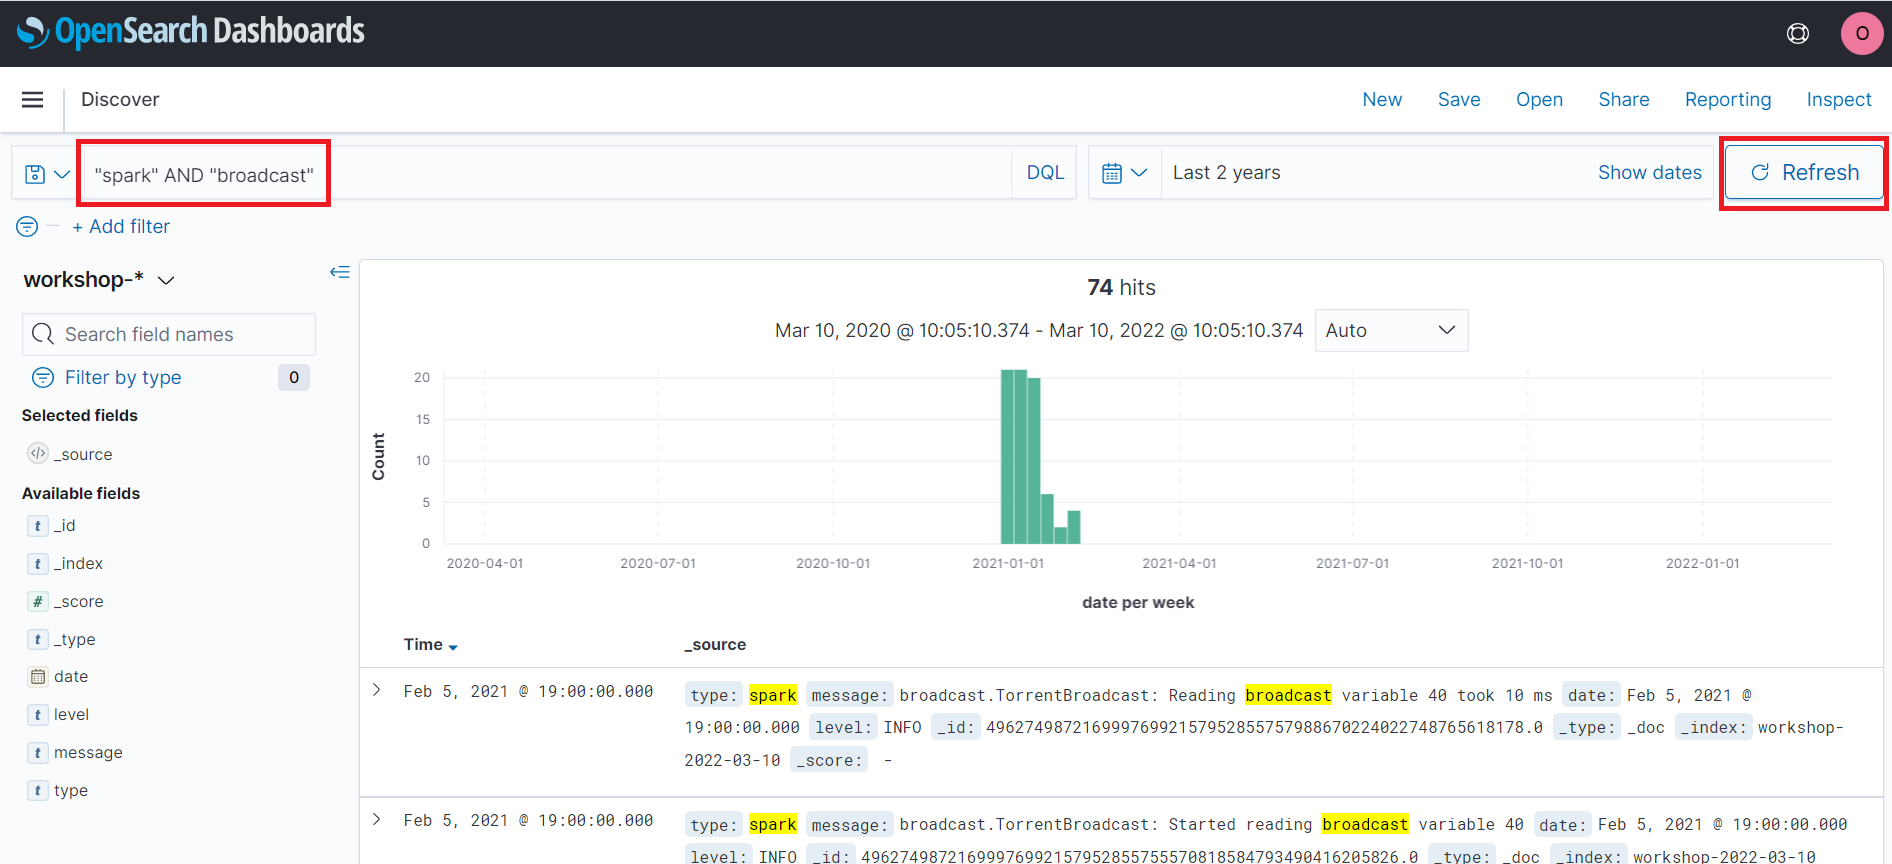
We can now run a few different searched against our index pattern. To get started lets look for any log messages that related to spark broadcast operations.
- Run the search
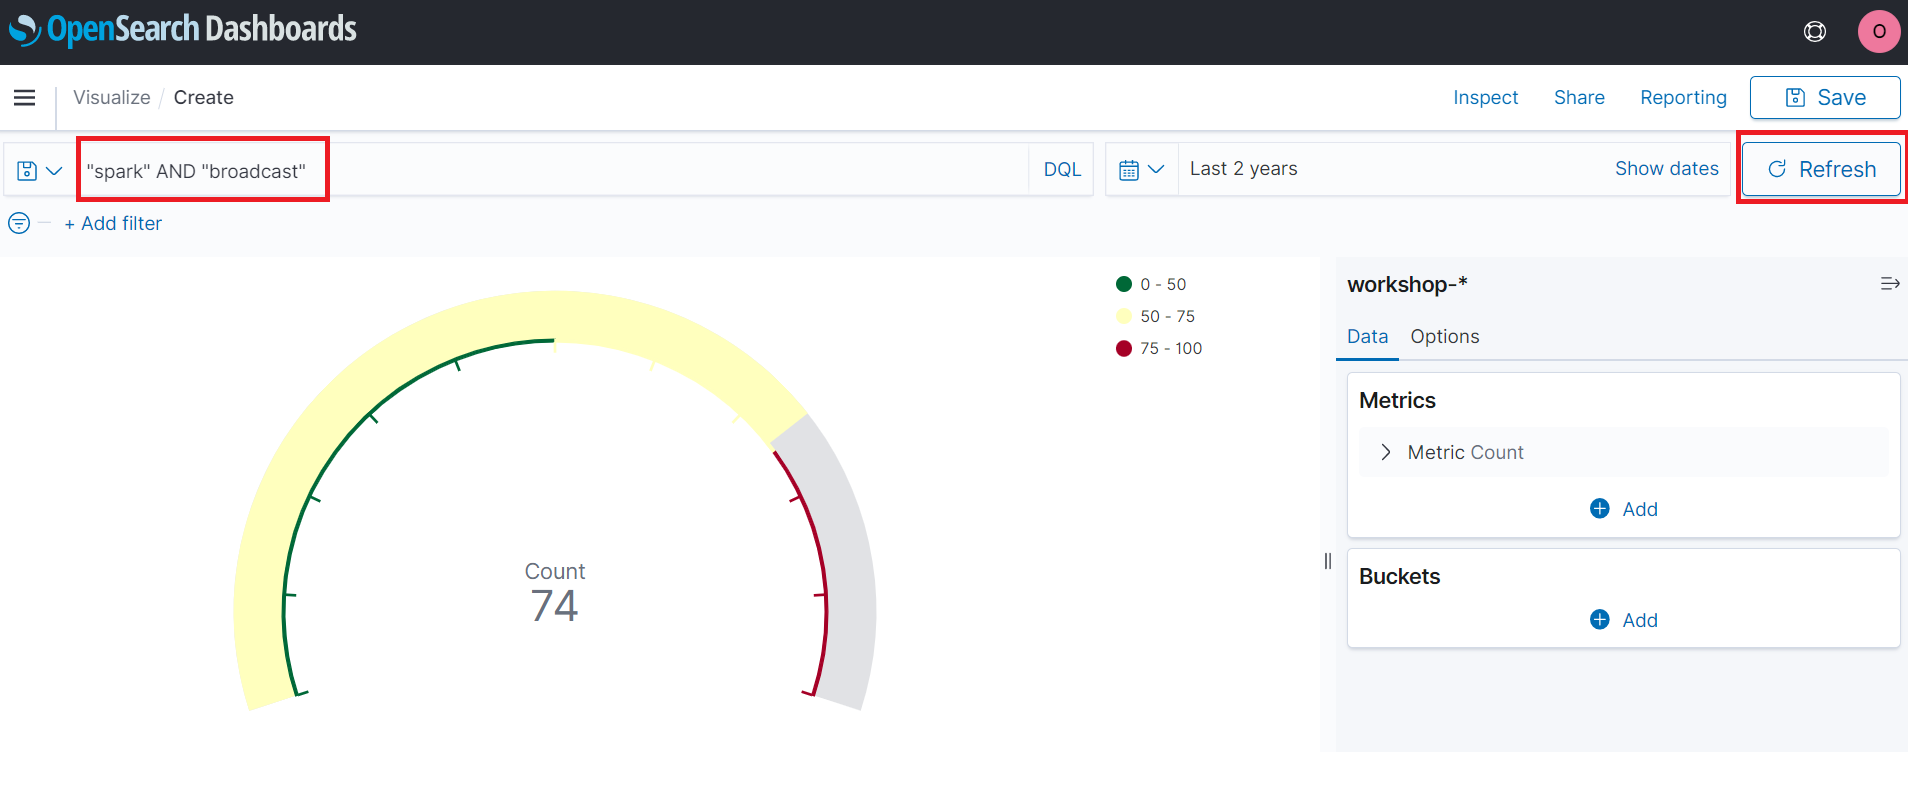
"spark" AND "broadcast"
OpenSearch displays the 74 logs of the total 2000 logs. Now that you have run a search. Try running at least 3 other searches. A few search suggestions are below. However feel free to come up with you own
Suggested searches
date:2021-01-01date:2021-01-01 AND message:Memorydate<2021-01-01
After you have run a few searches. We can look at creating a visualization and dashboard
Create a Visualization
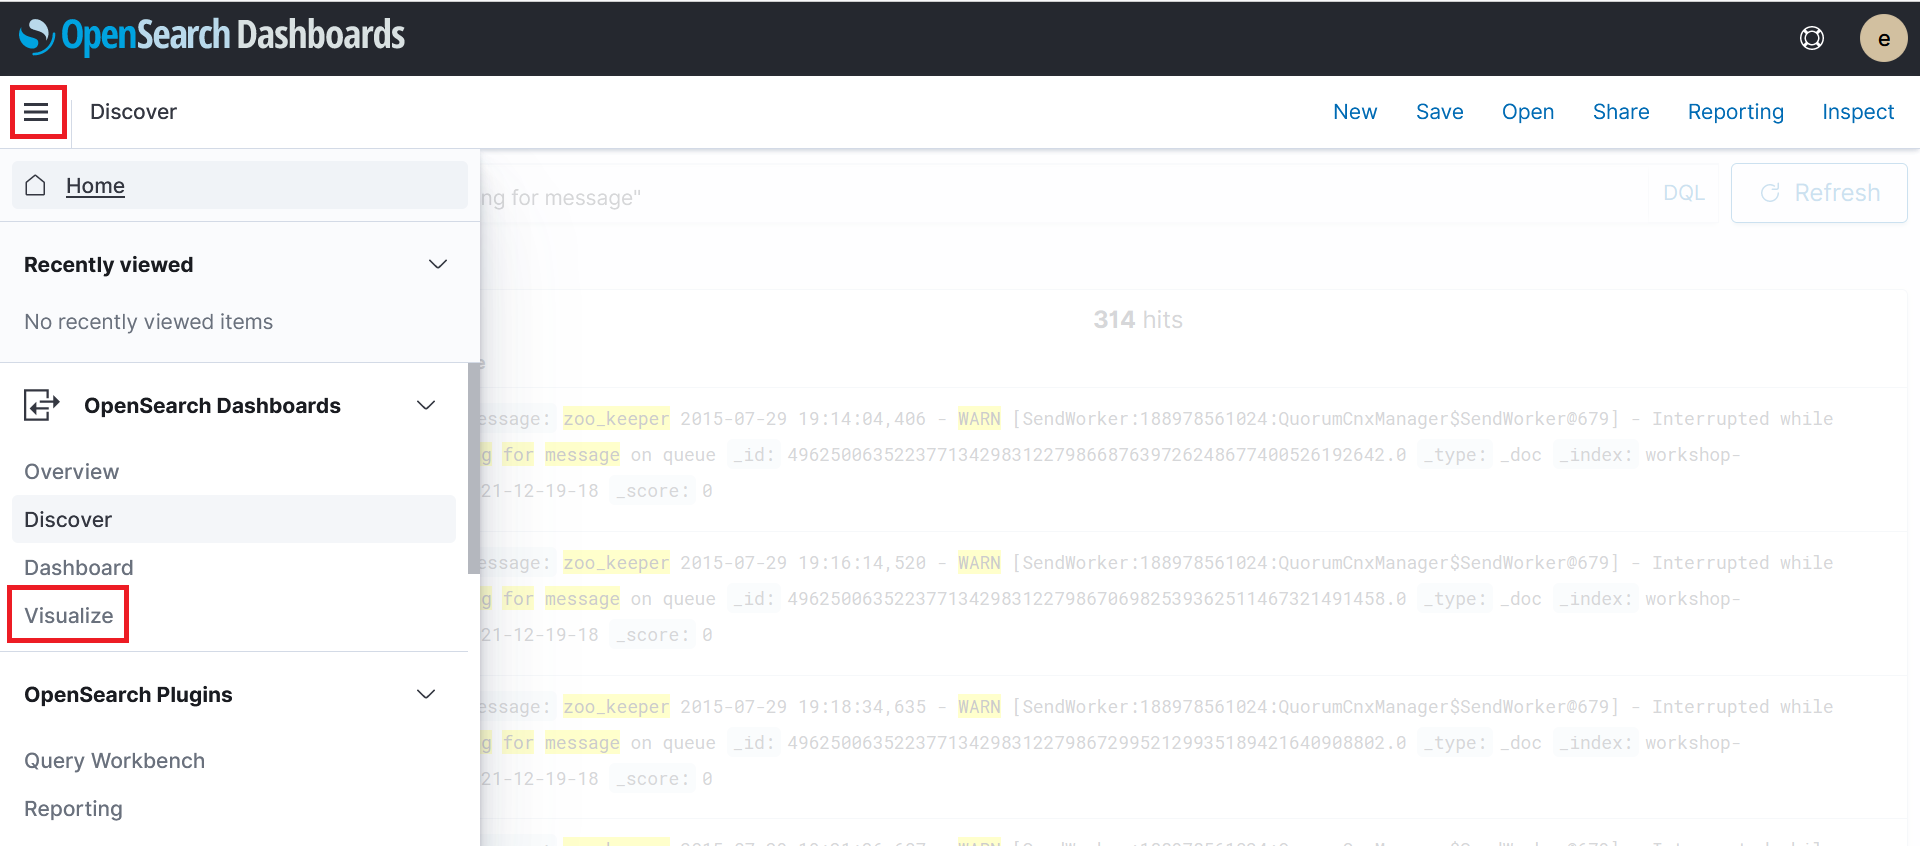
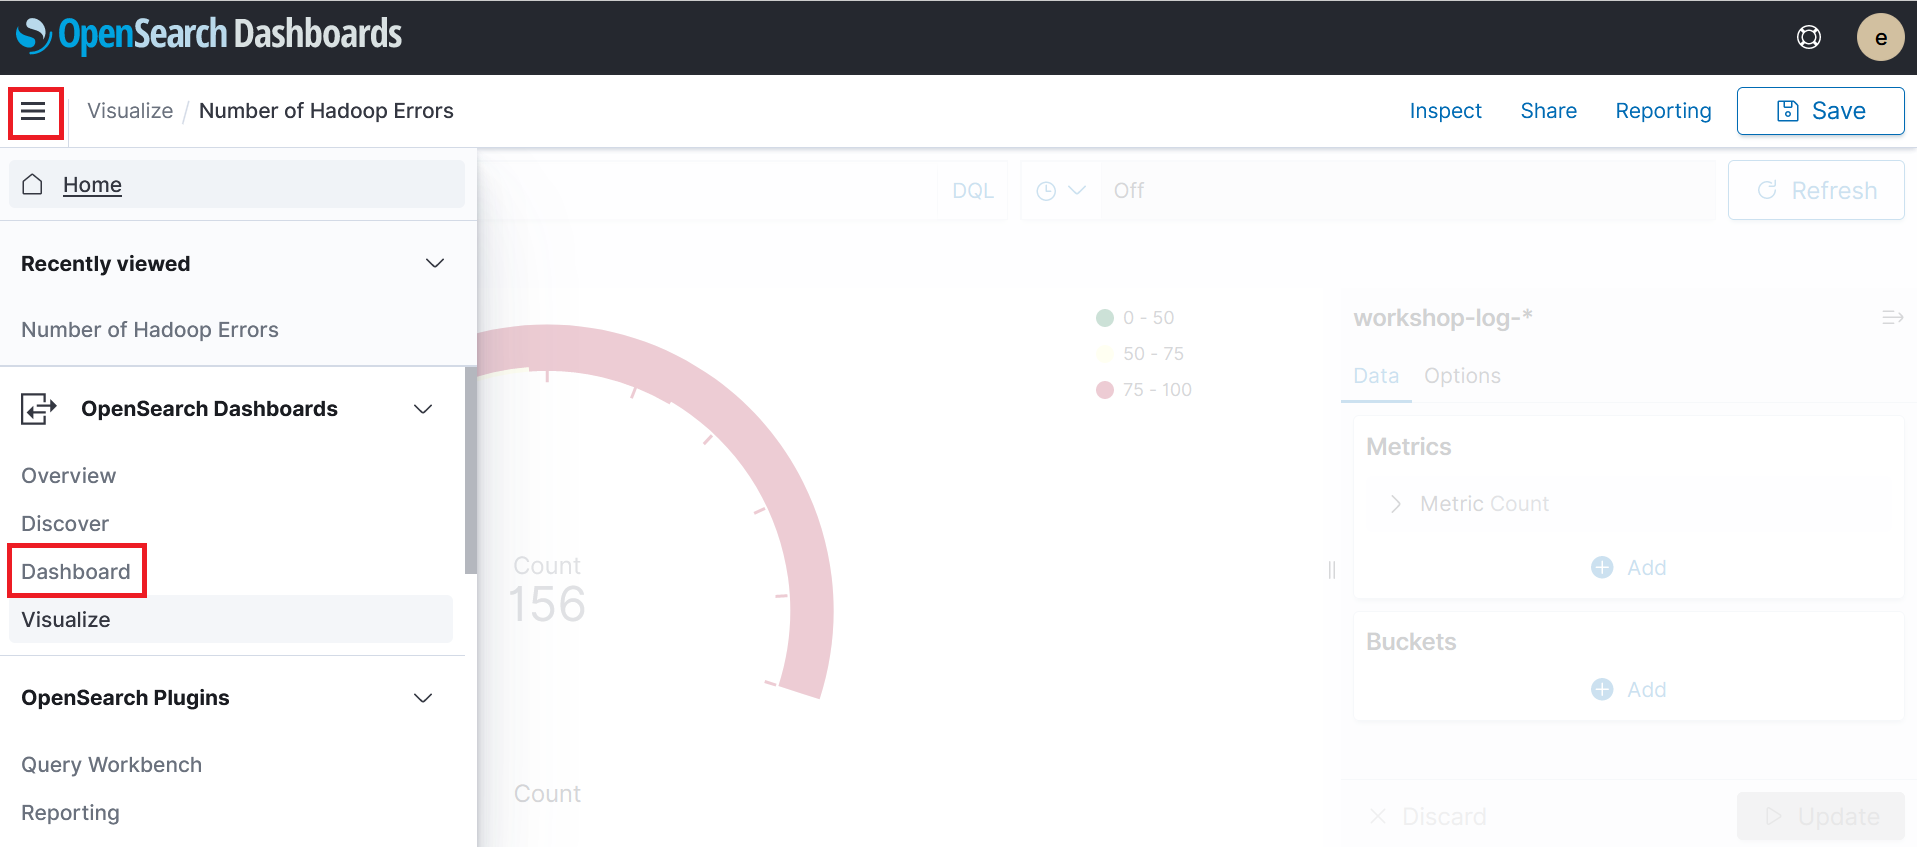
- In the OpenSearch Dashboard expand the side menu and click on Visualize under the OpenSearch Dashboards section
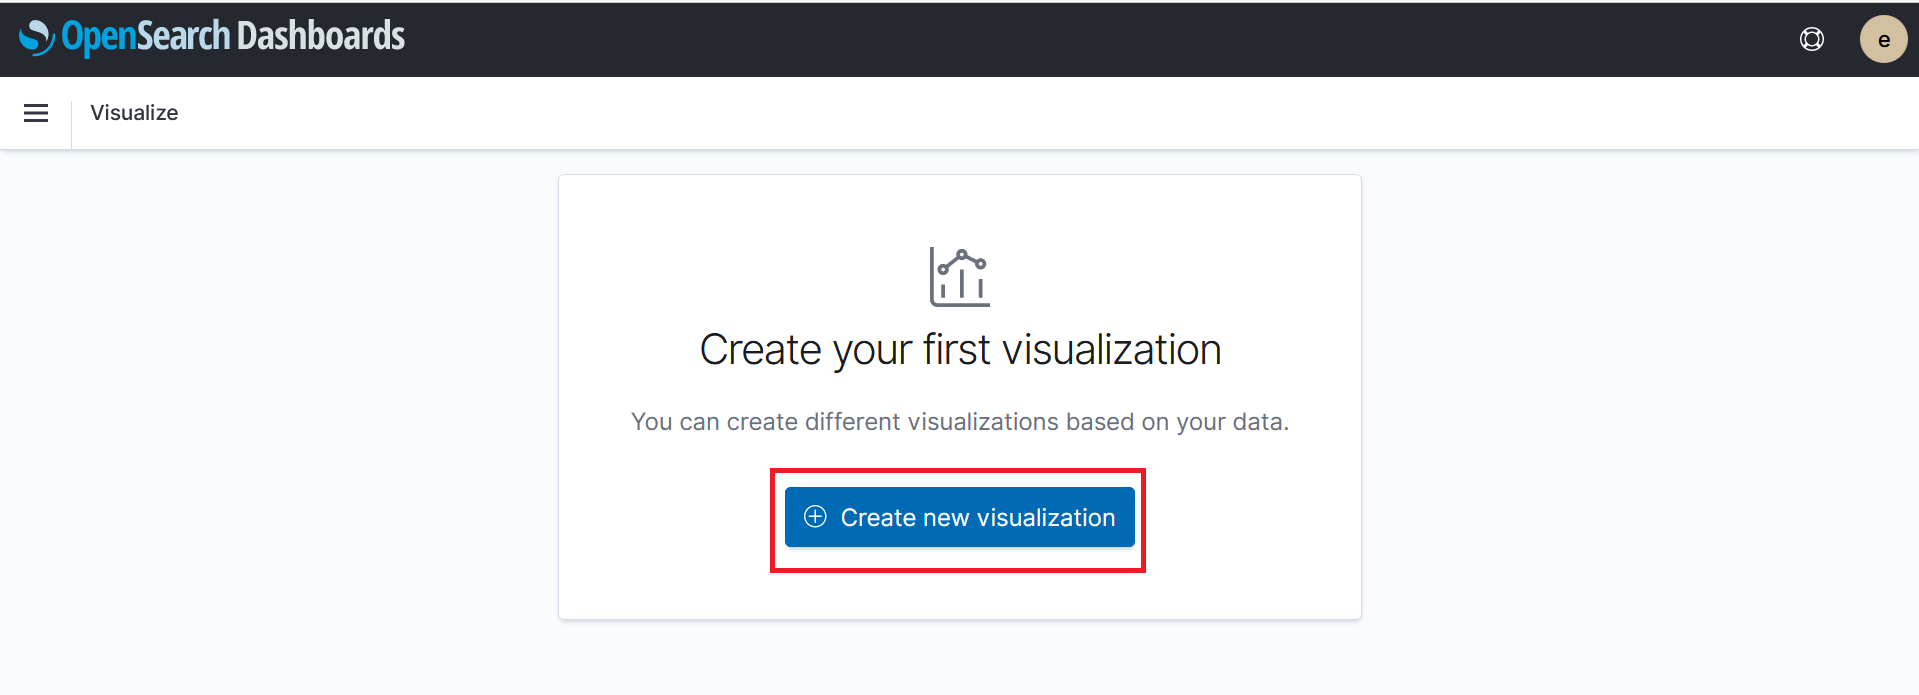
- Click on Create new visualization
- Click on Gauge from the list of visualizations
- Click workshop- from the list of index patterns
- Click on date/time filter next to the search bar
- Configure the relative date range for 2 years
- Click on the Update
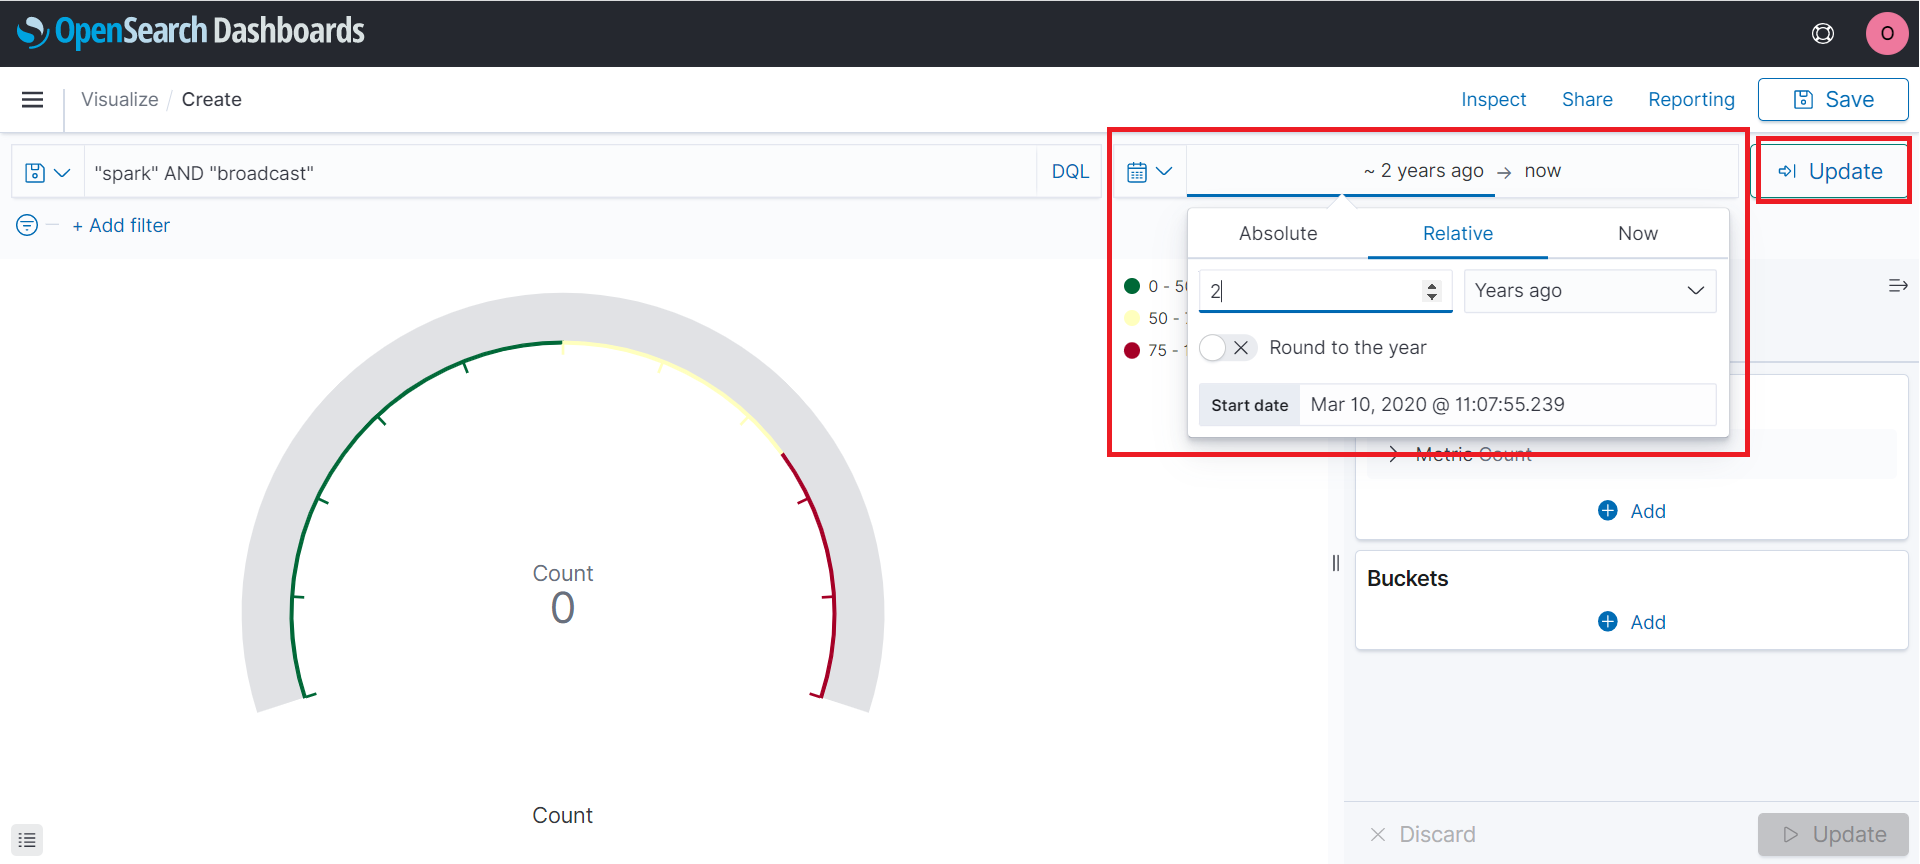
- On the create page enter
"spark" AND "broadcast"in the search bar
This will produce a gauge chart visual.
- Click on the Save button. Name the visual anything you would like
Create a Dashboard
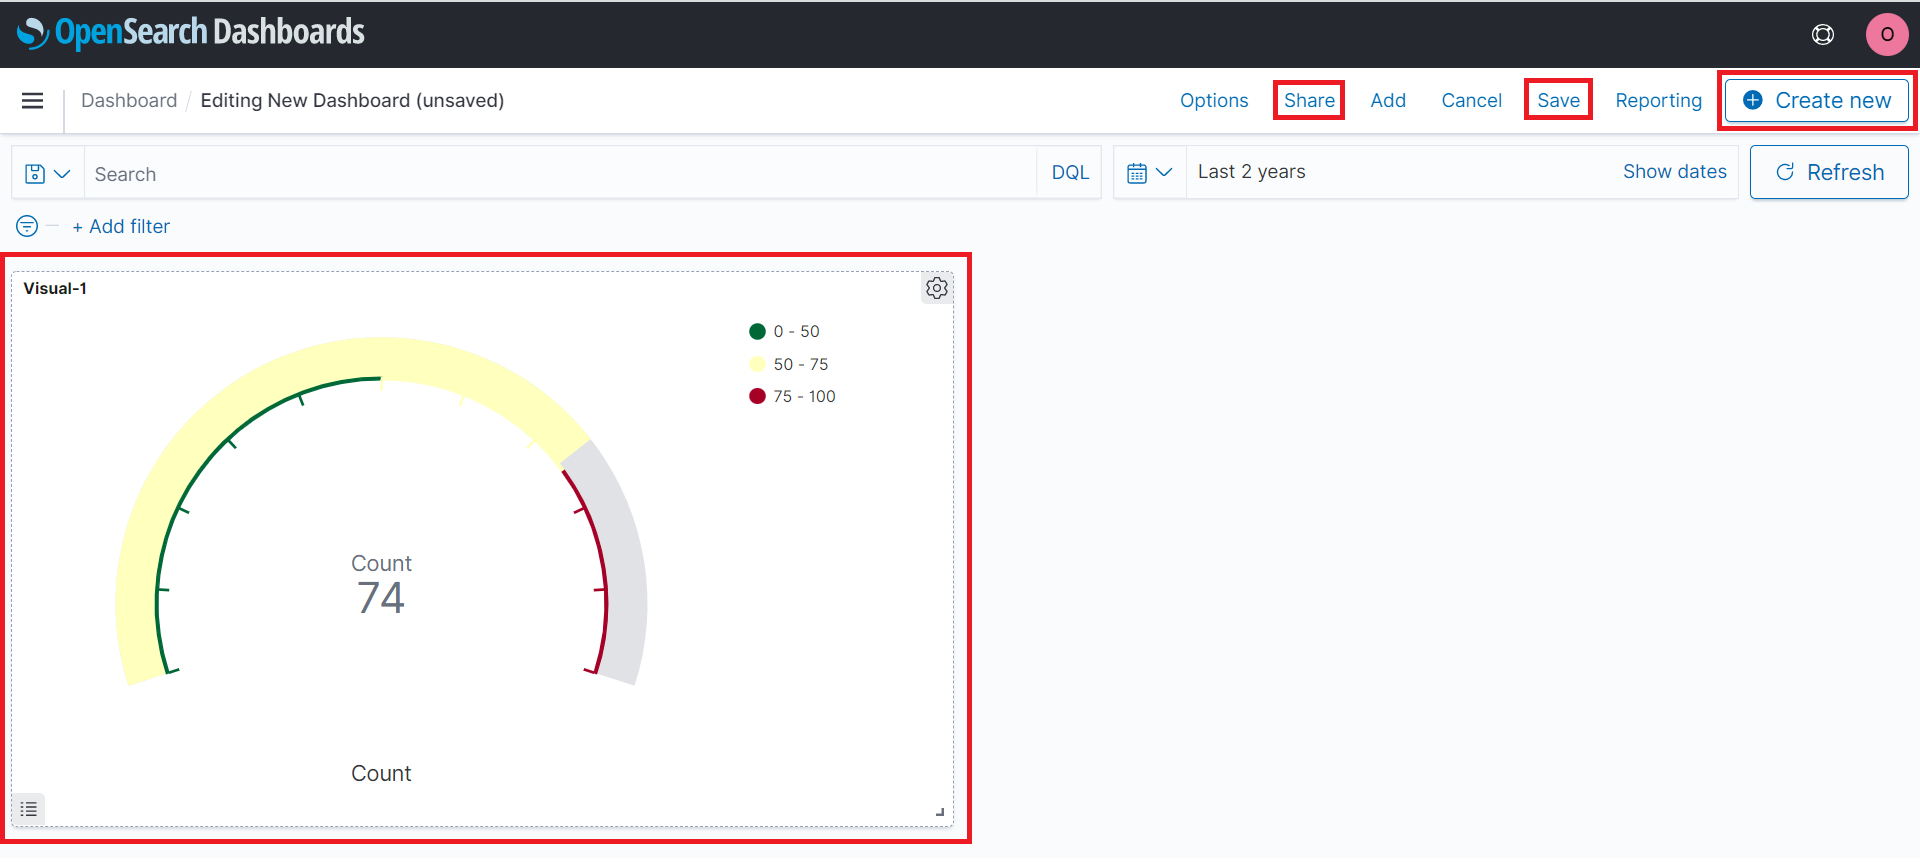
Dashboards allow you to combine multiple visualizations in a single place. Let’s build a simple dashboard
- In the OpenSearch Dashboard expand the side menu and click on Dashboards under the OpenSearch Dashboards section
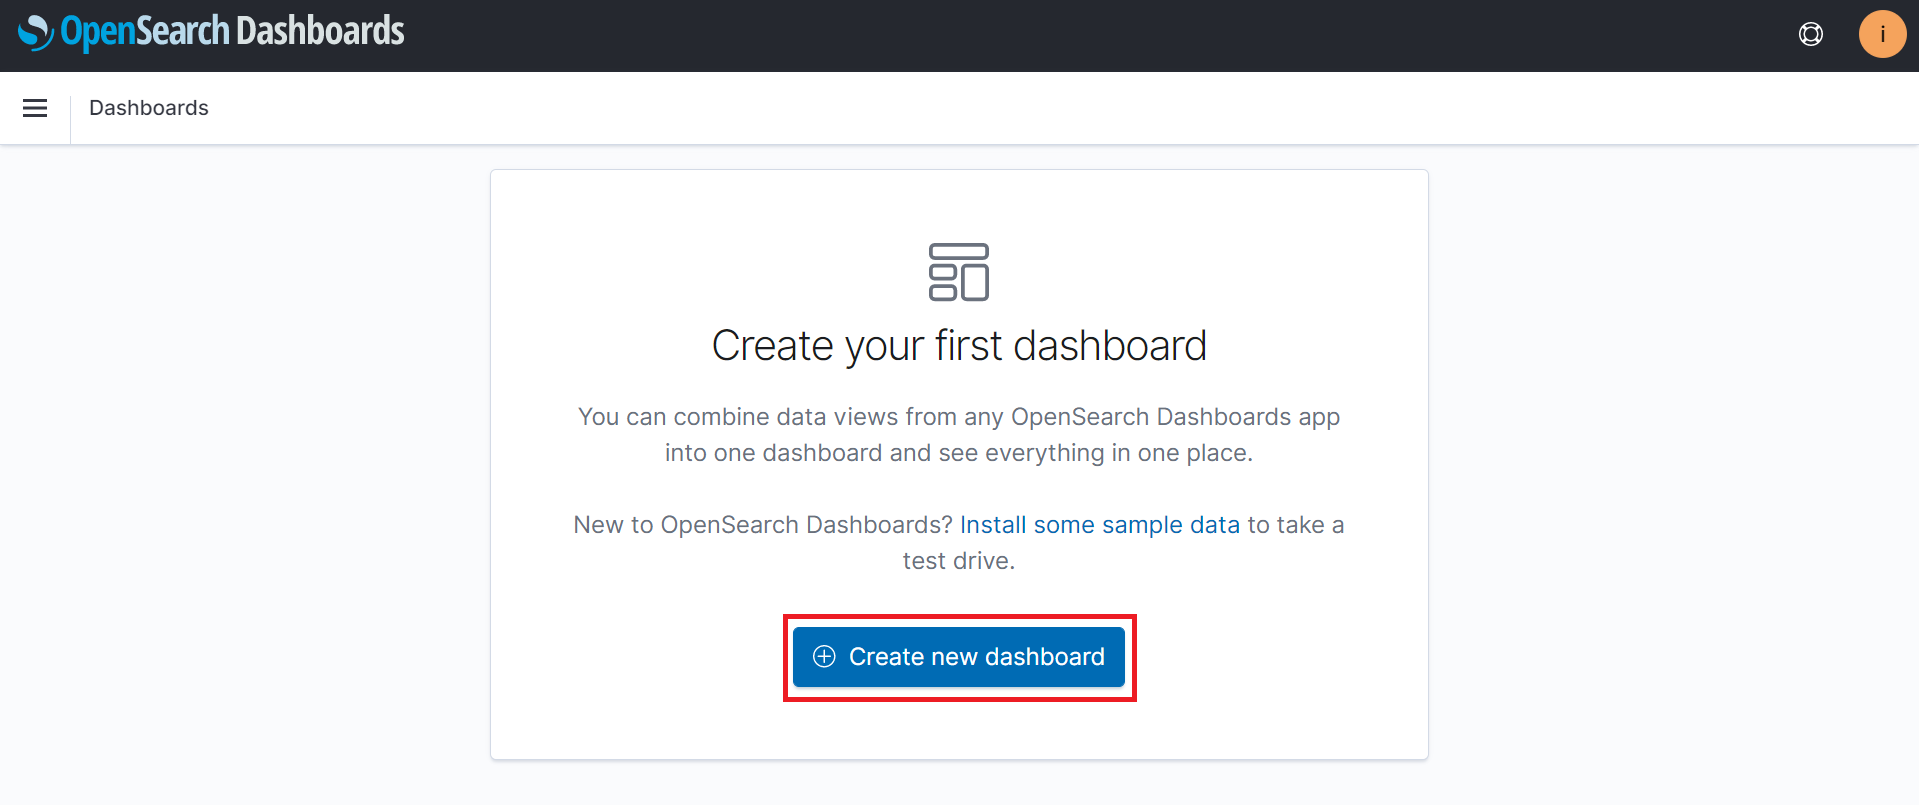
- On the dashboard page click on Create new dashboard
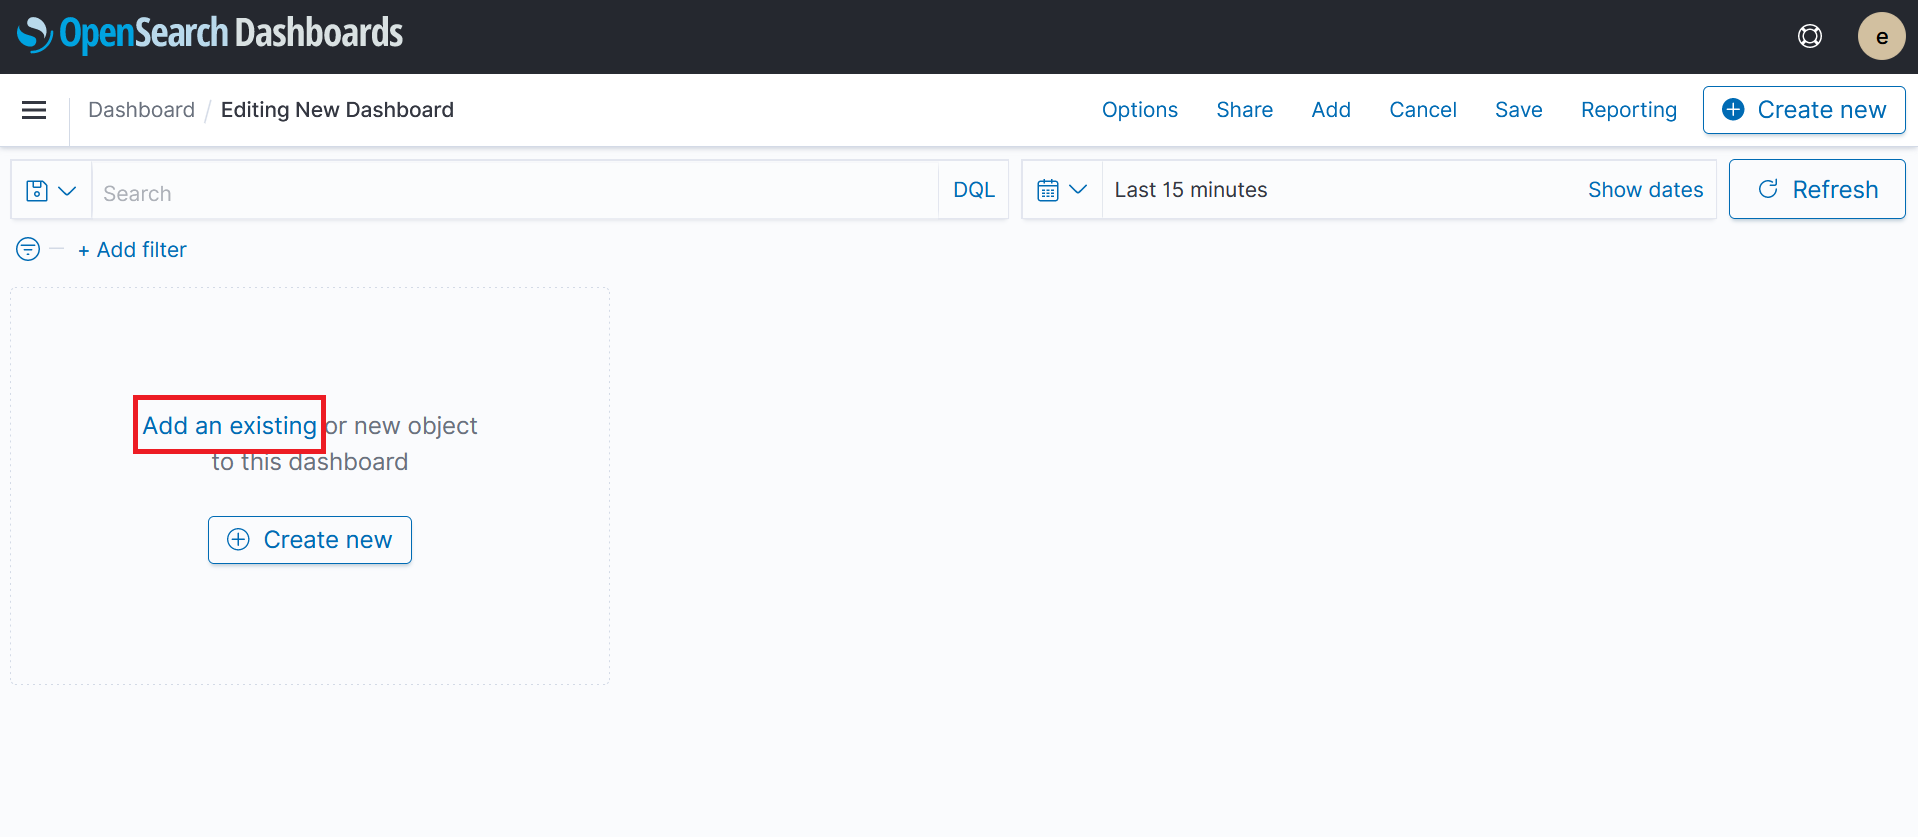
- On the dashboard page click on Add an existing
- Select the visualization you just created.
Use the create new button or repeat the earlier process to create at least 2 additional visuals. Try to create visuals that can show
- Horizontal bar chart showing how many logs we received per day
- Bar chart showing the number of logs level (ie. ERROR, WARNING, INFO)
When you are ready proceed to the next step Clean Up if you want to delete the resources we used for this workshop
